average survival rate of new businesses in the us\nwhich statement is supported by information in the…
average survival rate of new businesses in the us\nwhich statement is supported by information in the graph?\nall industries healthcare industry\nbusinesses in some industries have a greater chance of survival than in others.\nbusinesses in the healthcare industry are more likely to fail.\nless than half of businesses in the healthcare industry survive more than five years.\nmost businesses fail after just one year.\npercentage that survive\n0% 0 1 2 3 4 5 6 7 8 9 10\nnumber of years after start - up
Answer
Brief Explanations:
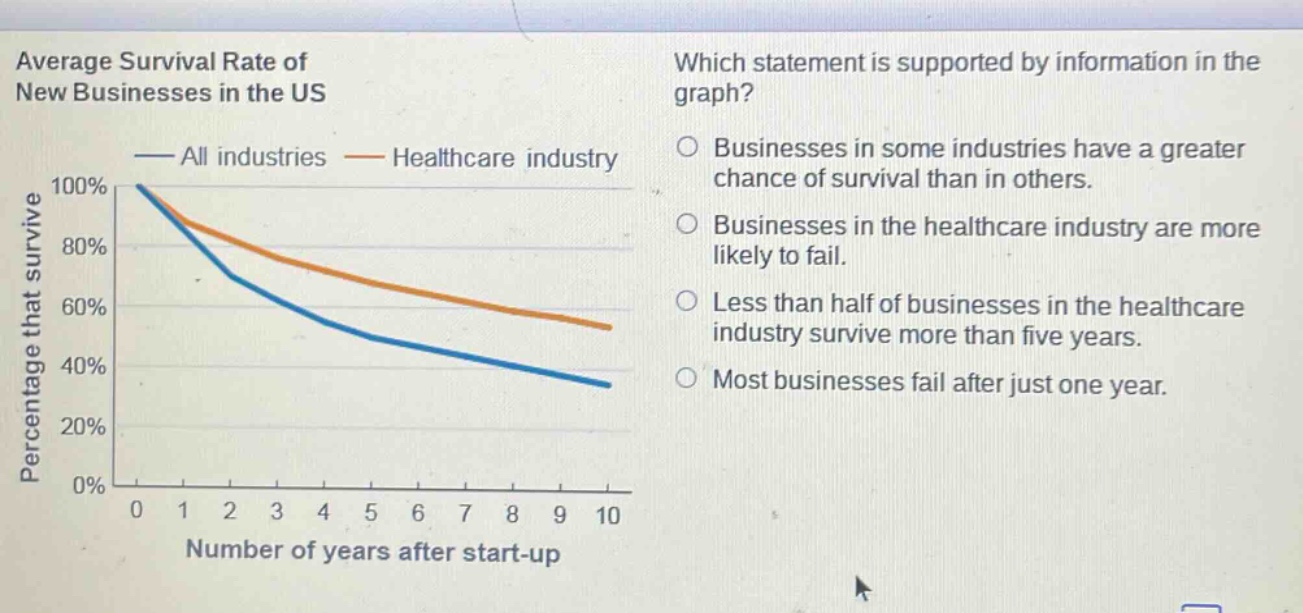
The graph displays the survival rates of new businesses over ten years, comparing the average across all industries (blue line) with the healthcare industry (orange line).
- Analyze Option 1: The healthcare industry line is consistently above the "All industries" line, indicating that businesses in the healthcare sector have a higher survival rate than the average. This directly supports the statement that survival chances vary between industries.
- Analyze Option 2: Since the healthcare industry has a higher survival rate than the average, businesses in this sector are less likely to fail, not more. This statement is contradicted by the graph.
- Analyze Option 3: At the 5-year mark, the survival rate for the healthcare industry (orange line) is approximately 70%, which is significantly more than half (50%). This statement is false.
- Analyze Option 4: At the 1-year mark, the survival rate for "All industries" is about 80%, and for the healthcare industry, it's about 90%. This means only 10-20% fail within the first year, so most businesses survive the first year. This statement is false. Therefore, the only statement supported by the graph is that survival rates differ among industries.
Answer:
Businesses in some industries have a greater chance of survival than in others.