based on this graph, which employee is likely to have the greatest sales next month?\na. ben\nb. marcel\nc…
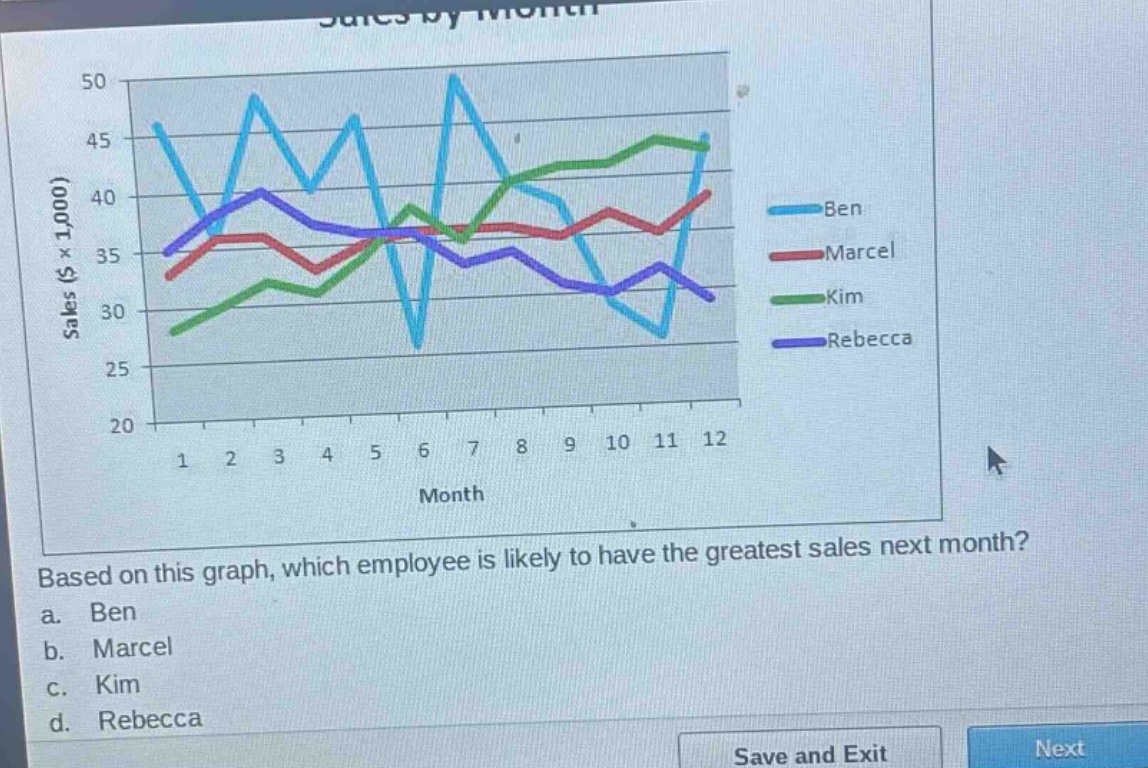
based on this graph, which employee is likely to have the greatest sales next month?\na. ben\nb. marcel\nc. kim\nd. rebecca
Answer
Answer:
c. Kim
Explanation:
Step1: Observe graph trends
By looking at the graph, we see the sales trends of each employee over 12 months.
Step2: Analyze future - likely sales
Kim's sales have been steadily increasing towards the end of the 12 - month period, while Ben's are fluctuating, Marcel's have a slow increase, and Rebecca's are decreasing. So Kim is most likely to have the greatest sales next month.