the circle graph shows how the annual budget for a company is divided by department. use this graph to…
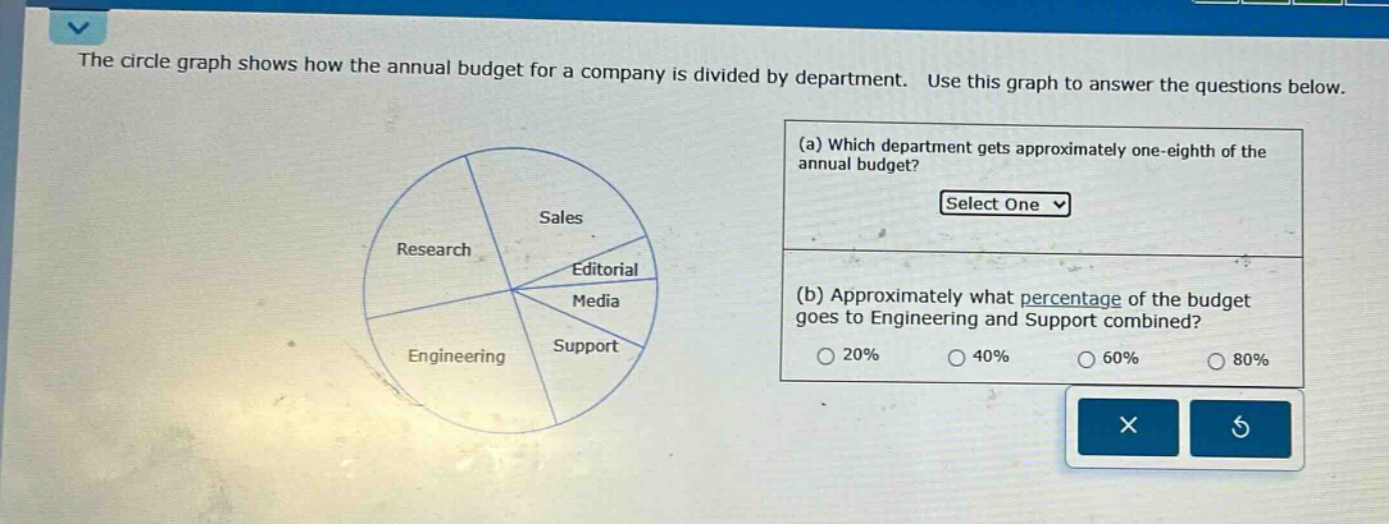
the circle graph shows how the annual budget for a company is divided by department. use this graph to answer the questions below. (a) which department gets approximately one - eighth of the annual budget? select one (b) approximately what percentage of the budget goes to engineering and support combined? 20% 40% 60% 80%
Answer
Explanation:
Step1: Analyze one - eighth in a circle graph
One - eighth of a circle graph corresponds to an angle of $\frac{1}{8}\times360^{\circ}=45^{\circ}$. By visually inspecting the circle graph, we try to find the department with a sector angle close to $45^{\circ}$.
Step2: Estimate combined percentage for Engineering and Support
Visually estimate the size of the sectors for Engineering and Support. The combined sectors of Engineering and Support seem to take up about 40% of the circle graph.
Answer:
(a) [No options provided in the question to select from, unable to give a specific answer] (b) 40%