the circle graph shows how the annual budget for a company is divided by department. use this graph to…
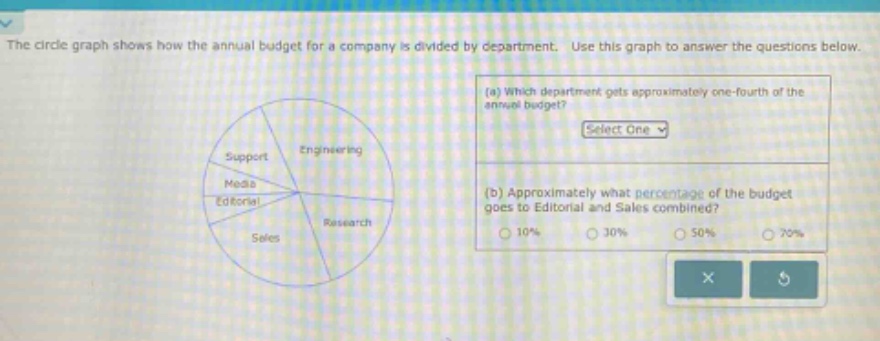
the circle graph shows how the annual budget for a company is divided by department. use this graph to answer the questions below. (a) which department gets approximately one - fourth of the annual budget? select one (b) approximately what percentage of the budget goes to editorial and sales combined? 10% 30% 50% 70%
Answer
Explanation:
Step1: Analyze one - fourth of circle
A full - circle is 360 degrees. One - fourth of 360 degrees is 90 degrees. By visually inspecting the pie - chart, we can see which sector is approximately 90 degrees.
Step2: Analyze combined percentage
Estimate the percentage of the Editorial and Sales sectors by visually comparing their combined size to the whole circle. The Editorial and Sales sectors together seem to be about 30% of the circle.
Answer:
(a) Engineering (b) 30%