claire examines the profitability of product a over 5 years, which is shown on this graph. which of the…
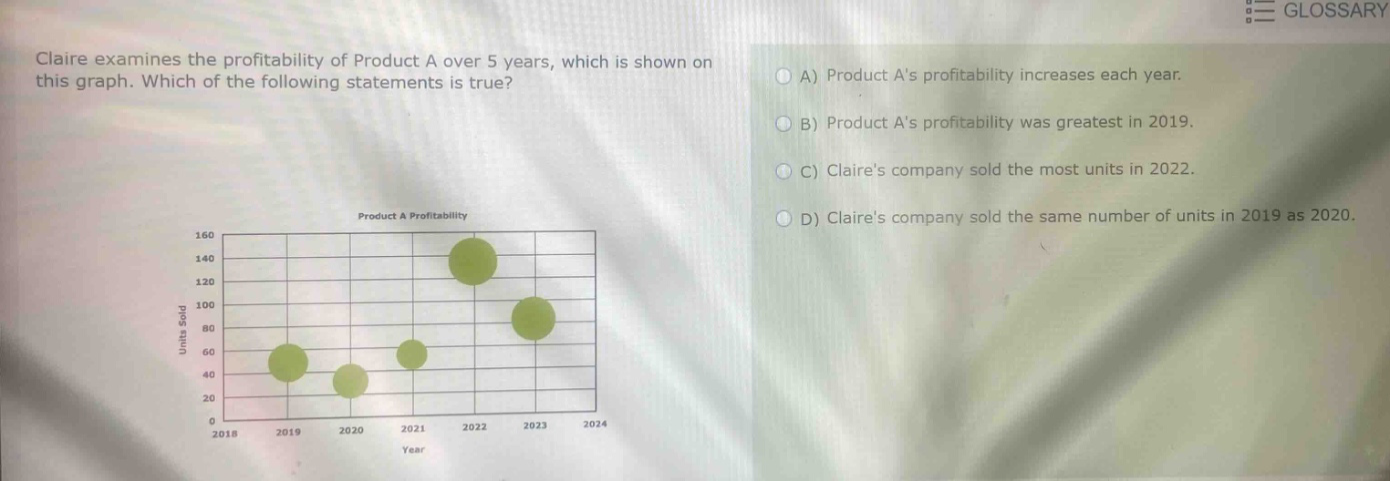
claire examines the profitability of product a over 5 years, which is shown on this graph. which of the following statements is true? a) product as profitability increases each year. b) product as profitability was greatest in 2019. c) claires company sold the most units in 2022. d) claires company sold the same number of units in 2019 as 2020.
Answer
Explanation:
Step1: Analyze option A
The graph shows fluctuations in profitability, not a continuous increase each year. So option A is false.
Step2: Analyze option B
The highest - point on the graph for Product A's profitability is in 2022, not 2019. So option B is false.
Step3: Analyze option C
The size of the green circles represents the profitability. The largest circle is in 2022, which implies that the profitability was the greatest in 2022. Higher profitability may be associated with more units sold (assuming other factors like cost - price relationships are stable). So it is reasonable to say that the company sold the most units in 2022. Option C is true.
Step4: Analyze option D
There is no information in the graph to suggest that the number of units sold in 2019 is the same as in 2020. The circles have different sizes for these years, indicating different levels of profitability and no evidence of equal unit - sales. So option D is false.
Answer:
C. Claire's company sold the most units in 2022.