a company that produces strawberry, grape, and raspberry jam tracked the costs to make each type of jam each…
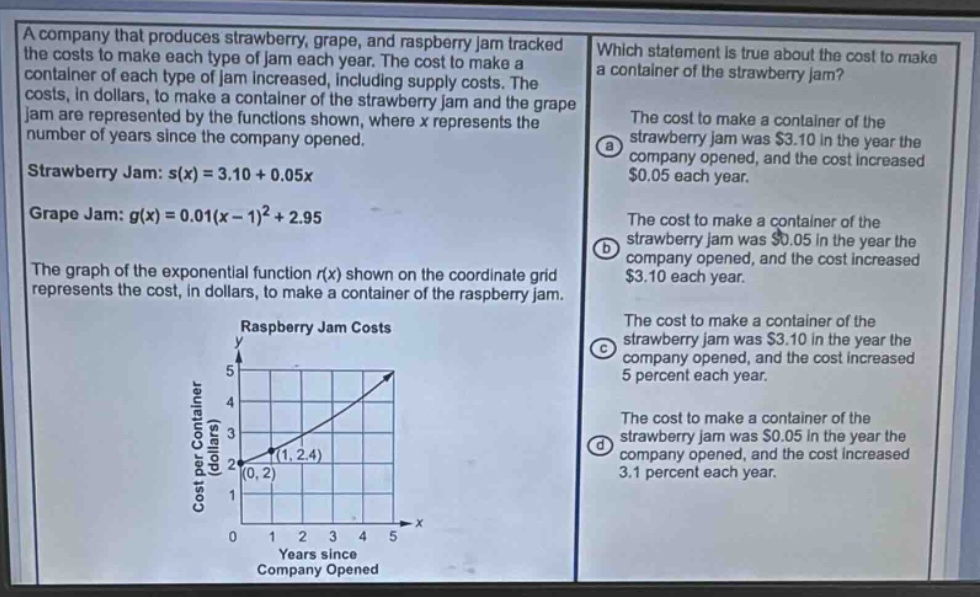
a company that produces strawberry, grape, and raspberry jam tracked the costs to make each type of jam each year. the cost to make a container of each type of jam increased, including supply costs. the costs, in dollars, to make a container of the strawberry jam and the grape jam are represented by the functions shown, where x represents the number of years since the company opened.\nstrawberry jam: s(x)=3.10 + 0.05x\ngrape jam: g(x)=0.01(x - 1)^2+2.95\nthe graph of the exponential function r(x) shown on the coordinate grid represents the cost, in dollars, to make a container of the raspberry jam.\nwhich statement is true about the cost to make a container of the strawberry jam?\nthe cost to make a container of the strawberry jam was $3.10 in the year the company opened, and the cost increased $0.05 each year.\nthe cost to make a container of the strawberry jam was $0.05 in the year the company opened, and the cost increased $3.10 each year.\nthe cost to make a container of the strawberry jam was $3.10 in the year the company opened, and the cost increased 5 percent each year.\nthe cost to make a container of the strawberry jam was $0.05 in the year the company opened, and the cost increased 3.1 percent each year.
Answer
Explanation:
Step1: Determine initial cost of strawberry jam
When ( x = 0 ) (year company opened), ( s(0) = 3.10 + 0.05 \times 0 = 3.10 ) dollars.
Step2: Determine annual cost increase
The function ( s(x) = 3.10 + 0.05x ) is linear with slope ( 0.05 ), meaning cost increases by $0.05 each year.
Answer:
A. The cost to make a container of the strawberry jam was $3.10 in the year the company opened, and the cost increased $0.05 each year.