darrell tracked the number of employees in his company over a six - year period. in the graph, x represents…
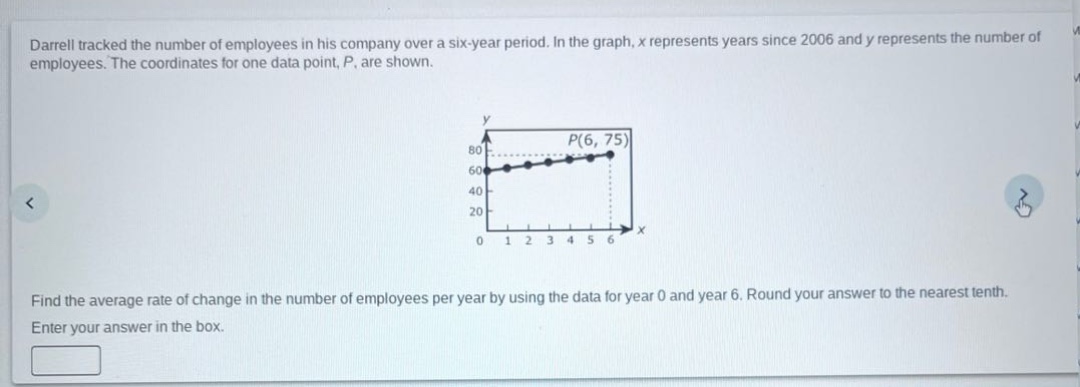
darrell tracked the number of employees in his company over a six - year period. in the graph, x represents years since 2006 and y represents the number of employees. the coordinates for one data point, p, are shown. find the average rate of change in the number of employees per year by using the data for year 0 and year 6. round your answer to the nearest tenth. enter your answer in the box.
Answer
Explanation:
Step1: Identificar los valores iniciales y finales
En el año 0 ($x_1 = 0$), el número de empleados $y_1=60$ (se puede ver en el gráfico). En el año 6 ($x_2 = 6$), el número de empleados $y_2 = 75$.
Step2: Aplicar la fórmula de tasa de cambio promedio
La fórmula para la tasa de cambio promedio es $\frac{y_2 - y_1}{x_2 - x_1}$. Sustituyendo los valores: $\frac{75 - 60}{6-0}=\frac{15}{6}$.
Step3: Simplificar y redondear
$\frac{15}{6}=2.5$.
Answer:
$2.5$