employees at a manufacturing plant have seen production rates change by approximately 105% annually. in…
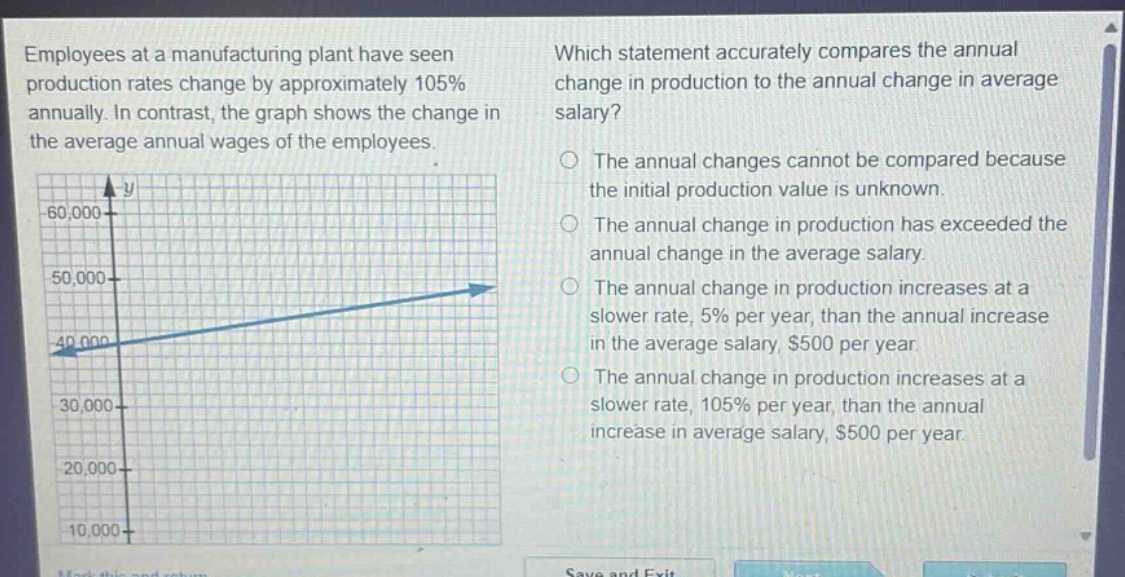
employees at a manufacturing plant have seen production rates change by approximately 105% annually. in contrast, the graph shows the change in the average annual wages of the employees. which statement accurately compares the annual change in production to the annual change in average salary? the annual changes cannot be compared because the initial production value is unknown. the annual change in production has exceeded the annual change in the average salary. the annual change in production increases at a slower rate, 5% per year, than the annual increase in the average salary, $500 per year. the annual change in production increases at a slower rate, 105% per year, than the annual increase in average salary, $500 per year.
Answer
Explanation:
Step1: Analyze production rate change
The production rate changes by approximately 105% annually. This means if the initial production is $P_0$, the production after one - year $P_1=(1 + 1.05)P_0 = 2.05P_0$, a significant growth.
Step2: Analyze salary change from graph
From the graph of average annual wages, assume the initial salary is $S_0$ and after one - year the salary is $S_1$. If we consider two points on the line, say $(x_0,S_0)$ and $(x_1,S_1)$ where $x_1=x_0 + 1$. The slope of the line representing the salary gives the annual change. By observing the grid, if we assume the $y$-axis is in dollars, we can see that the salary increases by $500$ per year.
Step3: Compare the changes
A 105% increase in production is a very large relative increase compared to a $500$ per - year increase in salary. So the annual change in production has exceeded the annual change in the average salary.
Answer:
The annual change in production has exceeded the annual change in the average salary.