the following table shows the 2017 federal income tax for a single person. let x denote the taxable income…
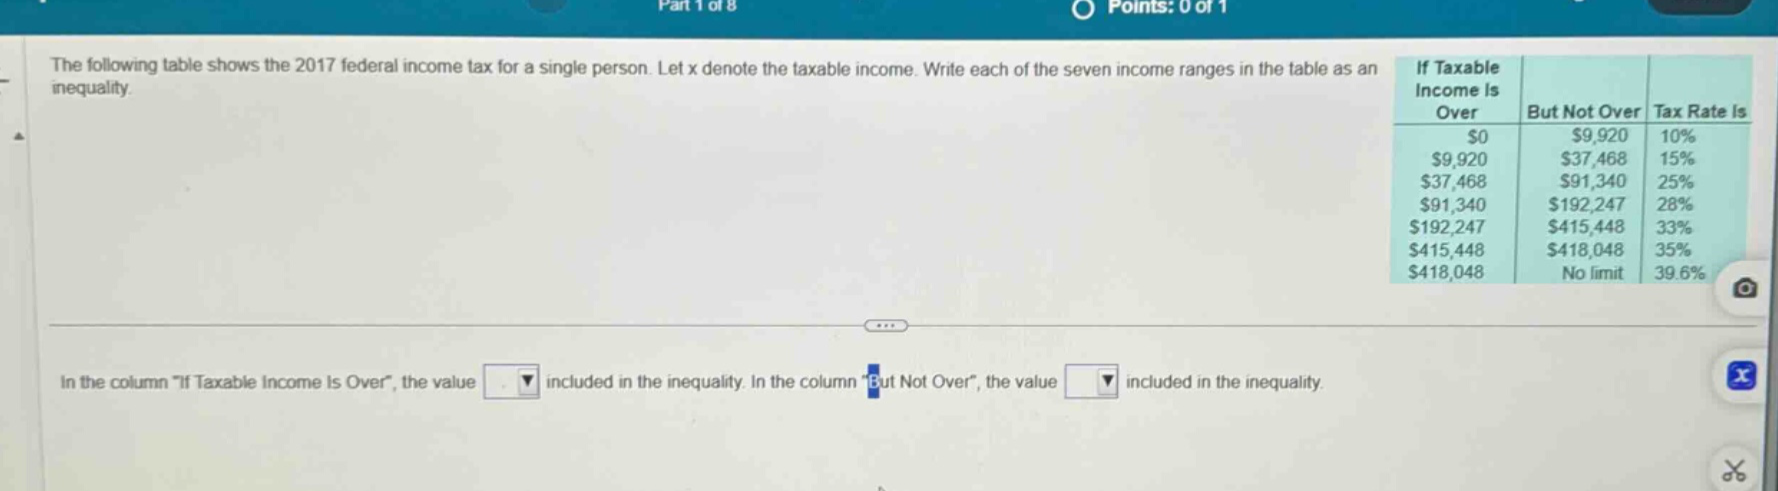
the following table shows the 2017 federal income tax for a single person. let x denote the taxable income. write each of the seven income ranges in the table as an inequality. if taxable income is over but not over tax rate is $0 $9,920 10% $9,920 $37,468 15% $37,468 $91,340 25% $91,340 $192,247 28% $192,247 $415,448 33% $415,448 $418,048 35% $418,048 no limit 39.6% in the column if taxable income is over, the value included in the inequality. in the column but not over, the value included in the inequality.
Answer
Explanation:
Step1: First income - range
The first range has taxable income over $0$ and not over $9920$. Since "over" is not inclusive and "not over" is inclusive, the inequality is $0 < x\leqslant9920$.
Step2: Second income - range
The second range has taxable income over $9920$ and not over $37468$. So the inequality is $9920 < x\leqslant37468$.
Step3: Third income - range
The third range has taxable income over $37468$ and not over $91340$. So the inequality is $37468 < x\leqslant91340$.
Step4: Fourth income - range
The fourth range has taxable income over $91340$ and not over $192247$. So the inequality is $91340 < x\leqslant192247$.
Step5: Fifth income - range
The fifth range has taxable income over $192247$ and not over $415448$. So the inequality is $192247 < x\leqslant415448$.
Step6: Sixth income - range
The sixth range has taxable income over $415448$ and not over $418048$. So the inequality is $415448 < x\leqslant418048$.
Step7: Seventh income - range
The seventh range has taxable income over $418048$ with no upper - limit. So the inequality is $x > 418048$.
Answer:
$0 < x\leqslant9920$; $9920 < x\leqslant37468$; $37468 < x\leqslant91340$; $91340 < x\leqslant192247$; $192247 < x\leqslant415448$; $415448 < x\leqslant418048$; $x > 418048$