the graph displays the relationship between the length of time an employee works at a company and the number…
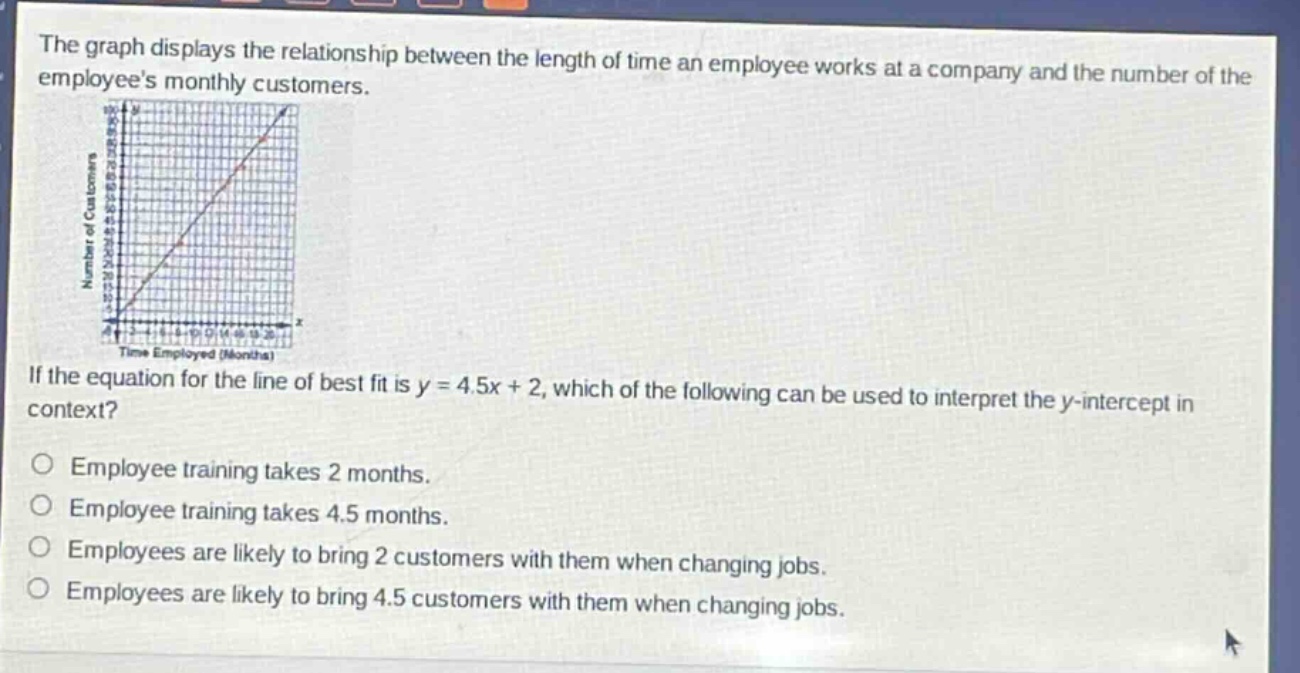
the graph displays the relationship between the length of time an employee works at a company and the number of the employees monthly customers. if the equation for the line of best fit is y = 4.5x + 2, which of the following can be used to interpret the y - intercept in context? employee training takes 2 months. employee training takes 4.5 months. employees are likely to bring 2 customers with them when changing jobs. employees are likely to bring 4.5 customers with them when changing jobs.
Answer
Brief Explanations:
In the linear - equation $y = mx + b$, where $y$ is the number of monthly customers, $x$ is the time employed in months, $m$ is the slope and $b$ is the y - intercept. When $x = 0$ (i.e., at the start, when an employee has just joined the company), $y=b$. So the y - intercept represents the number of customers an employee has when they start working at the company. It can be interpreted as the number of customers an employee brings with them when changing jobs. Here, $b = 2$, so employees are likely to bring 2 customers with them when changing jobs.
Answer:
Employees are likely to bring 2 customers with them when changing jobs.