the graph displays the relationship between the length of time an employee works at a company and the number…
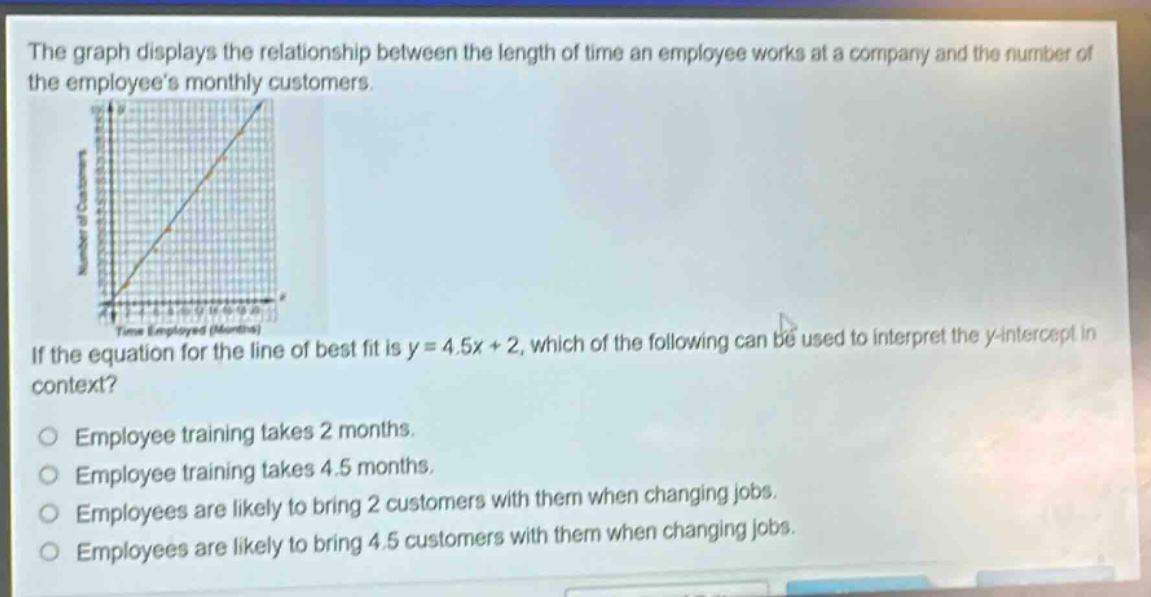
the graph displays the relationship between the length of time an employee works at a company and the number of the employees monthly customers.\nif the equation for the line of best fit is y = 4.5x + 2, which of the following can be used to interpret the y - intercept in context?\nemployee training takes 2 months.\nemployee training takes 4.5 months.\nemployees are likely to bring 2 customers with them when changing jobs.\nemployees are likely to bring 4.5 customers with them when changing jobs.
Answer
Brief Explanations:
The equation of a line is in the form $y = mx + b$, where $b$ is the y - intercept. In the context of the relationship between time employed ($x$) and number of monthly customers ($y$), when $x = 0$ (i.e., at the start, when an employee has just joined the company), $y=b$. Here, $b = 2$, which means employees are likely to bring 2 customers with them when starting at the company (equivalent to changing jobs to this company).
Answer:
Employees are likely to bring 2 customers with them when changing jobs.