the graph represents the cost of catering a dinner as a function of the number of guests. what is the…
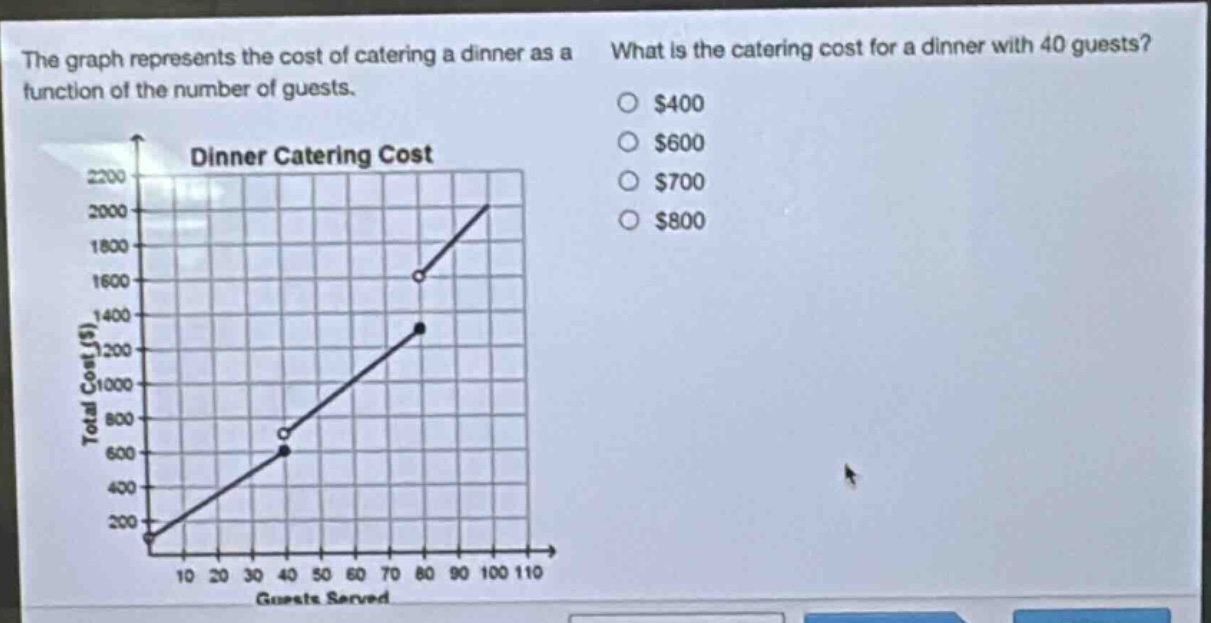
the graph represents the cost of catering a dinner as a function of the number of guests. what is the catering cost for a dinner with 40 guests? $400 $600 $700 $800 dinner catering cost total cost ($) 2200 2000 1800 1600 1400 1200 1000 800 600 400 200 0 10 20 30 40 50 60 70 80 90 100 110 guests served
Answer
Explanation:
Step1: Locate 40 on x - axis
Find the value of 40 on the "Guests Served" (x - axis).
Step2: Read corresponding y - value
Move vertically from 40 on x - axis to the line of the graph, then move horizontally to the y - axis (Total Cost ($)). The corresponding y - value is 600.
Answer:
$600