2. the graph to the right shows the revenue made by three sales associates over four quarters in 2016. which…
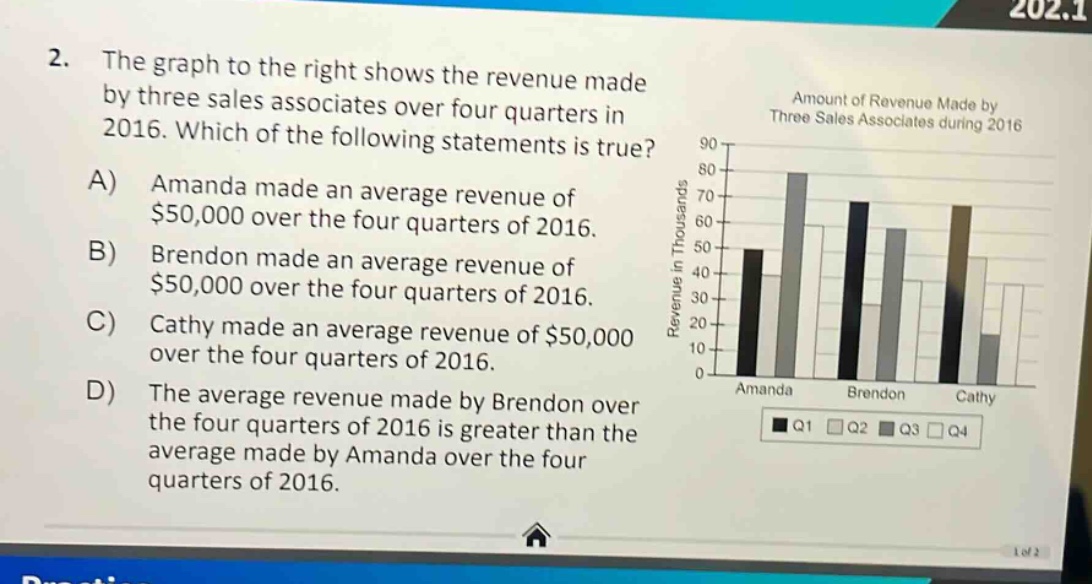
2. the graph to the right shows the revenue made by three sales associates over four quarters in 2016. which of the following statements is true? a) amanda made an average revenue of $50,000 over the four quarters of 2016. b) brendon made an average revenue of $50,000 over the four quarters of 2016. c) cathy made an average revenue of $50,000 over the four quarters of 2016. d) the average revenue made by brendon over the four quarters of 2016 is greater than the average made by amanda over the four quarters of 2016.
Answer
Explanation:
Step1: Recall average formula
Average = $\frac{\text{Sum of values}}{\text{Number of values}}$. Here number of values is 4 (4 quarters).
Step2: Estimate Amanda's revenue
From the bar - chart, Amanda's revenues (in thousands) seem to be approximately 50, 40, 80, 30. Sum = $50 + 40+80 + 30=200$. Average = $\frac{200}{4}=50$.
Step3: Estimate Brendon's revenue
Brendon's revenues (in thousands) seem to be approximately 70, 60, 50, 40. Sum = $70 + 60+50 + 40 = 220$. Average = $\frac{220}{4}=55$.
Step4: Estimate Cathy's revenue
Cathy's revenues (in thousands) seem to be approximately 60, 30, 20, 70. Sum = $60+30 + 20+70 = 180$. Average = $\frac{180}{4}=45$.
Answer:
A. Amanda made an average revenue of $50,000 over the four quarters of 2016.