the help desk is keeping track of the number of minutes the average caller spends on hold. according to the…
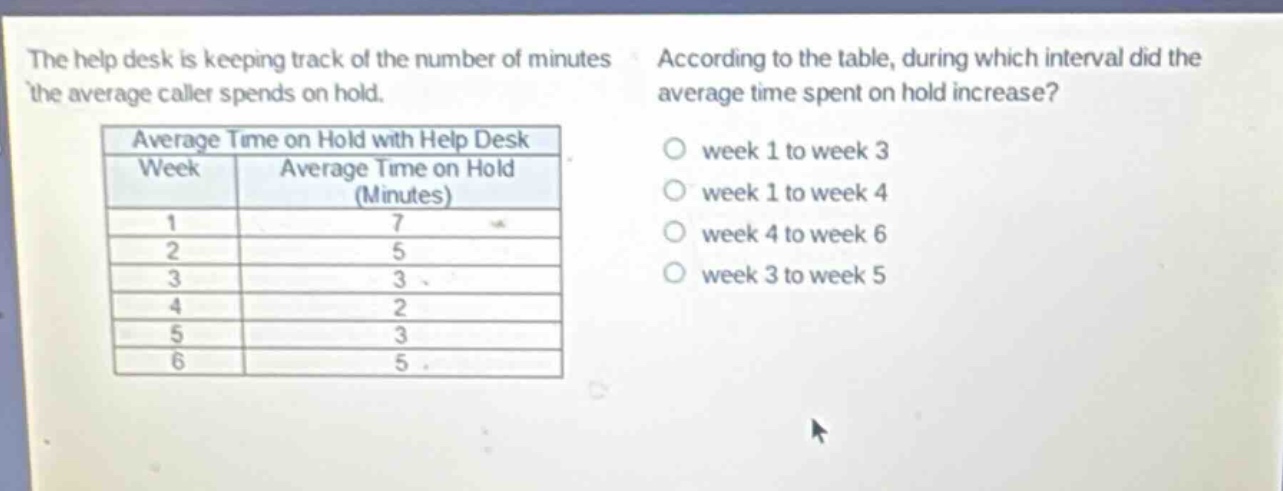
the help desk is keeping track of the number of minutes the average caller spends on hold. according to the table, during which interval did the average time spent on hold increase?\naverage time on hold with help desk\n| week | average time on hold (minutes) |\n| ---- | ---- |\n| 1 | 7 |\n| 2 | 5 |\n| 3 | 3 |\n| 4 | 2 |\n| 5 | 3 |\n| 6 | 5 |\no week 1 to week 3\no week 1 to week 4\no week 4 to week 6\no week 3 to week 5
Answer
Explanation:
Step1: Check week 1 - week 3
From week 1 (7 minutes) to week 2 (5 minutes) and week 3 (3 minutes), the time decreases.
Step2: Check week 1 - week 4
From week 1 (7 minutes) to week 2 (5 minutes), week 3 (3 minutes) and week 4 (2 minutes), the time decreases.
Step3: Check week 4 - week 6
Week 4 has 2 minutes, week 5 has 3 minutes and week 6 has 5 minutes. The time increases.
Step4: Check week 3 - week 5
From week 3 (3 minutes) to week 4 (2 minutes) and then to week 5 (3 minutes), the time first decreases then increases, but overall not a continuous increase.
Answer:
week 4 to week 6