jayla is the manager of super sandwiches. she recorded the number of sandwiches they sold each day during…
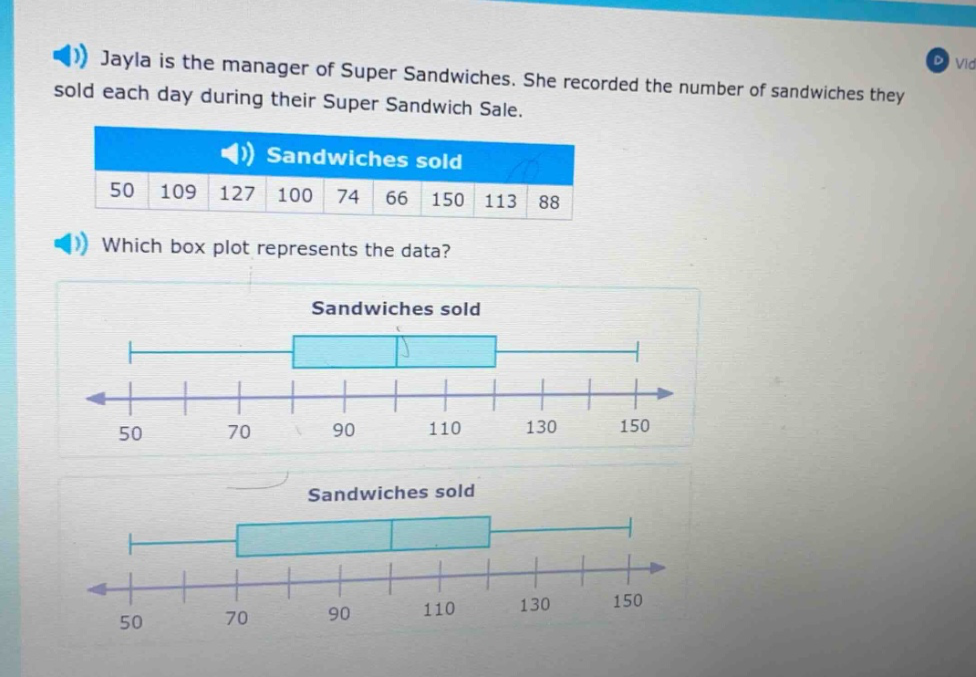
jayla is the manager of super sandwiches. she recorded the number of sandwiches they sold each day during their super sandwich sale. sandwiches sold 50 109 127 100 74 66 150 113 88 which box plot represents the data? sandwiches sold sandwiches sold
Answer
Explanation:
Step1: Arrange data in ascending order
$50,66,74,88,100,109,113,127,150$
Step2: Find the minimum value
The minimum value is $50$.
Step3: Find the first - quartile ($Q_1$)
There are $n = 9$ data points. The position of $Q_1$ is $\frac{n + 1}{4}=\frac{9+1}{4}=2.5$. So, $Q_1=\frac{66 + 74}{2}=70$.
Step4: Find the median ($Q_2$)
The position of the median is $\frac{n + 1}{2}=\frac{9+1}{2}=5$. So, $Q_2 = 100$.
Step5: Find the third - quartile ($Q_3$)
The position of $Q_3$ is $\frac{3(n + 1)}{4}=\frac{3\times(9 + 1)}{4}=7.5$. So, $Q_3=\frac{113+127}{2}=120$.
Step6: Find the maximum value
The maximum value is $150$.
The box - plot should have a minimum at $50$, $Q_1$ at $70$, median at $100$, $Q_3$ at $120$ and maximum at $150$.
Answer:
The box - plot with the minimum at $50$, the left - edge of the box at $70$, the line inside the box at $100$, the right - edge of the box at $120$ and the maximum at $150$ (the first box - plot shown in the image).