for the last 10 years, a school has sold raffle tickets as its fundraiser. the graph shows the schools total…
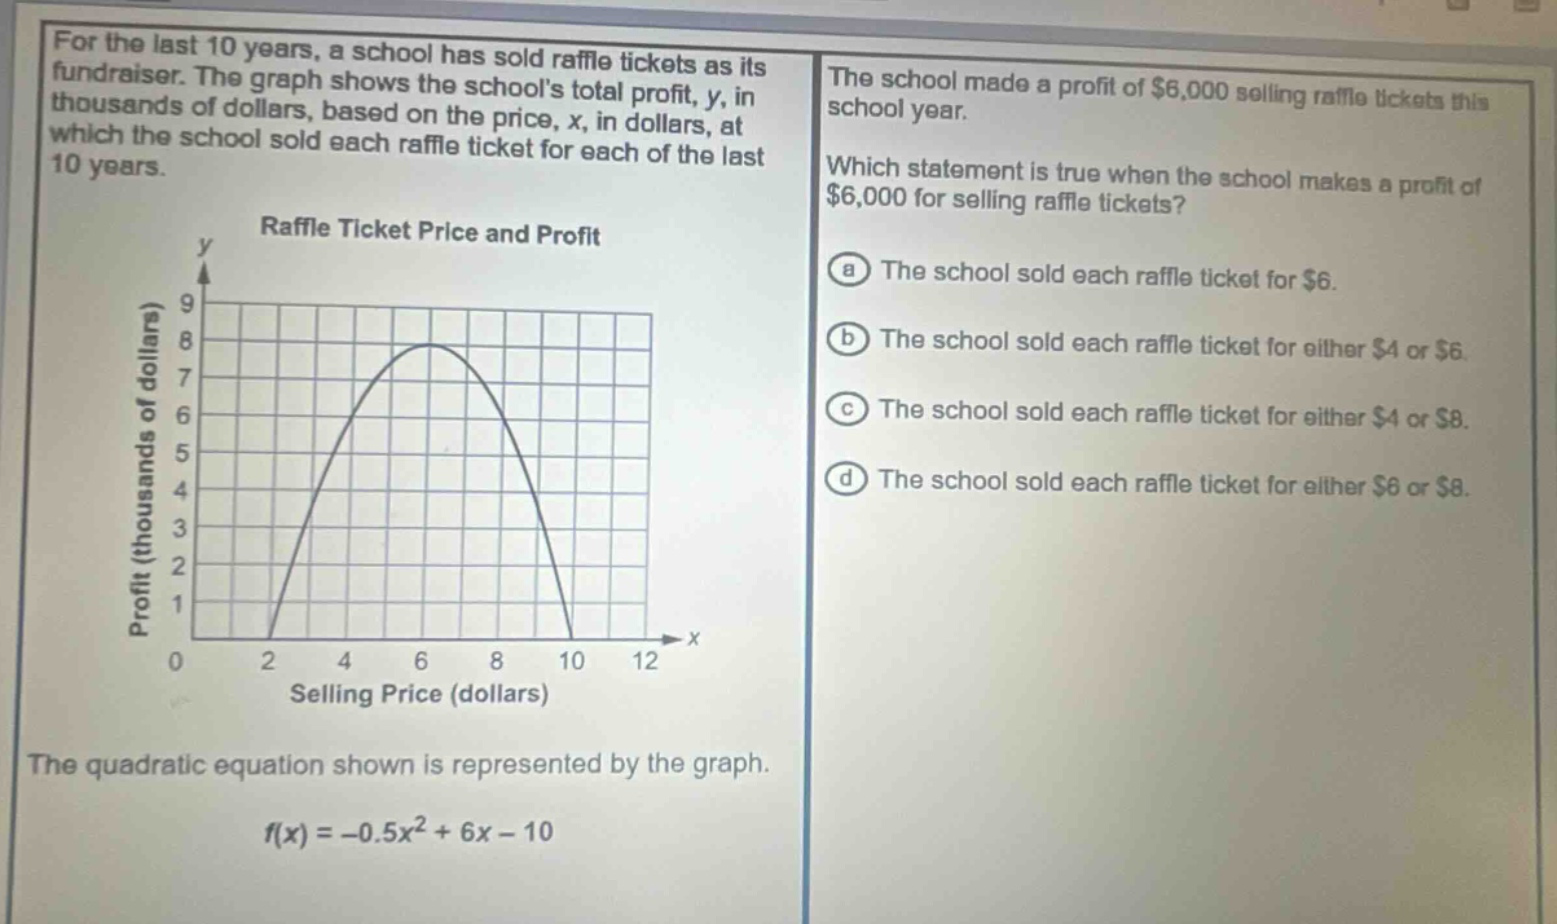
for the last 10 years, a school has sold raffle tickets as its fundraiser. the graph shows the schools total profit, y, in thousands of dollars, based on the price, x, in dollars, at which the school sold each raffle ticket for each of the last 10 years. the school made a profit of $6,000 selling raffle tickets this school year. which statement is true when the school makes a profit of $6,000 for selling raffle tickets? a the school sold each raffle ticket for $6. b the school sold each raffle ticket for either $4 or $6. c the school sold each raffle ticket for either $4 or $8. d the school sold each raffle ticket for either $6 or $8. the quadratic equation shown is represented by the graph. f(x)=-0.5x^{2}+6x - 10
Answer
Explanation:
Step1: Identify the profit value on the graph
The profit $y = 6$ (since the profit is in thousands of dollars and the school made a profit of $6000$).
Step2: Find the corresponding $x$-values
On the graph of $y=- 0.5x^{2}+6x - 10$, when $y = 6$, we can also visually see from the graph that the $x$-values (ticket - selling price) are $x = 4$ and $x = 8$.
Answer:
C. The school sold each raffle ticket for either $4 or $8.