a local office supply store has in - store customers and online customers. the store owner creates a graph…
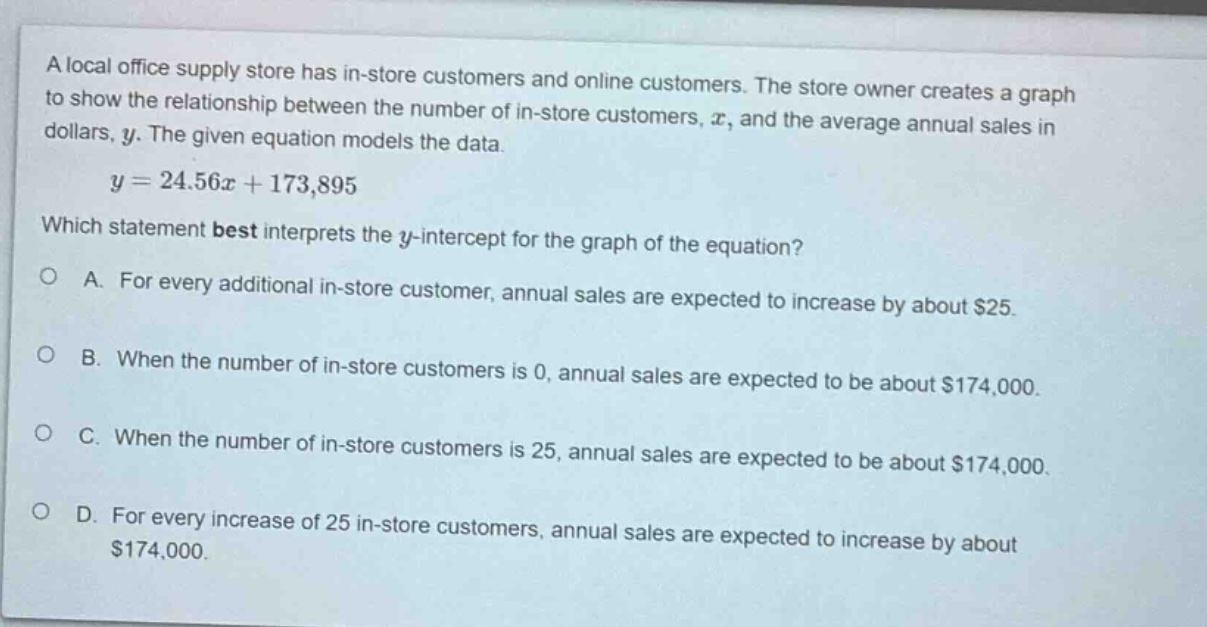
a local office supply store has in - store customers and online customers. the store owner creates a graph to show the relationship between the number of in - store customers, $x$, and the average annual sales in dollars, $y$. the given equation models the data.\n$y = 24.56x+173,895$\nwhich statement best interprets the $y$-intercept for the graph of the equation?\na. for every additional in - store customer, annual sales are expected to increase by about $25.\nb. when the number of in - store customers is 0, annual sales are expected to be about $174,000.\nc. when the number of in - store customers is 25, annual sales are expected to be about $174,000.\nd. for every increase of 25 in - store customers, annual sales are expected to increase by about $174,000.
Answer
Brief Explanations:
The equation of a line is in the form $y = mx + b$, where $b$ is the $y$-intercept. In the given equation $y = 24.56x+173895$, when $x = 0$ (number of in - store customers is 0), $y=173895\approx174000$. The $y$-intercept represents the value of $y$ (average annual sales) when $x$ (number of in - store customers) is 0.
Answer:
B. When the number of in - store customers is 0, annual sales are expected to be about $174,000.