the manager of a six - screen movie theater was analyzing the ticket - sales data for monday through friday…
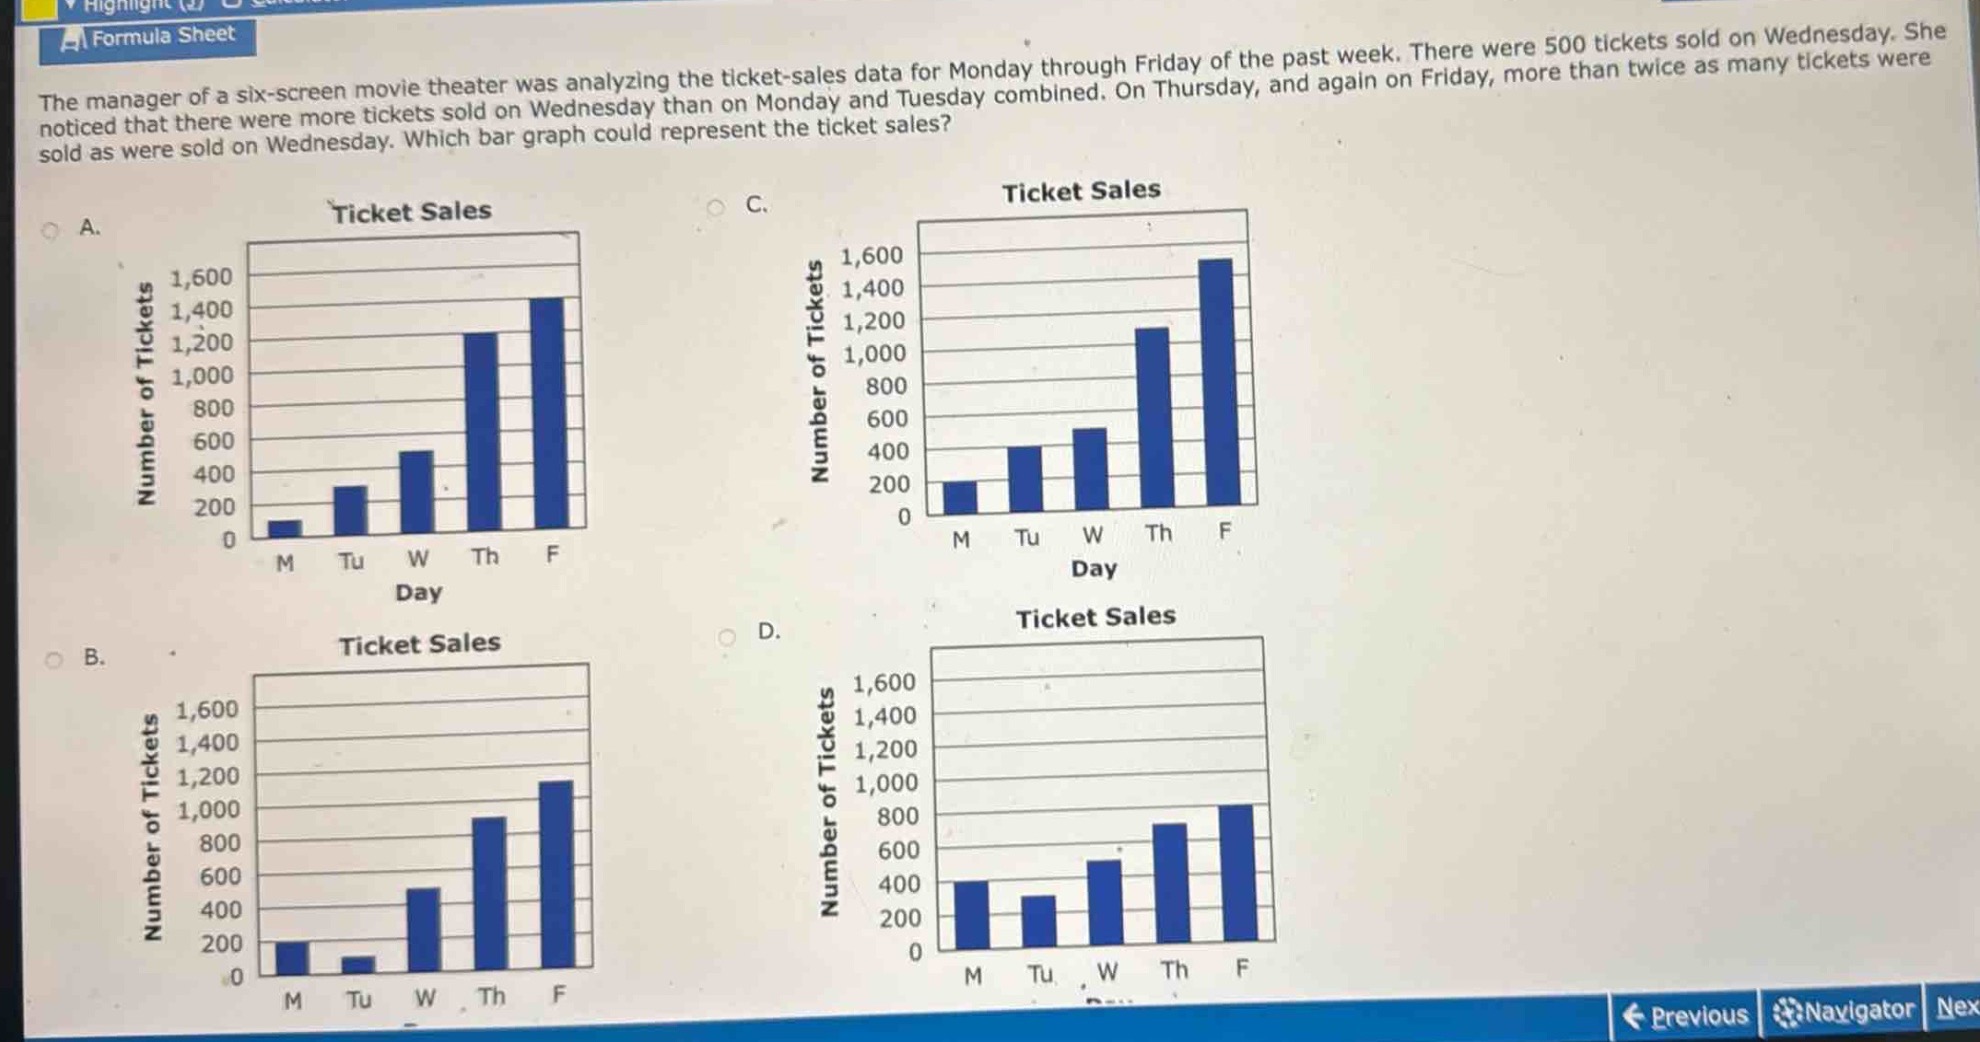
the manager of a six - screen movie theater was analyzing the ticket - sales data for monday through friday of the past week. there were 500 tickets sold on wednesday. she noticed that there were more tickets sold on wednesday than on monday and tuesday combined. on thursday, and again on friday, more than twice as many tickets were sold as were sold on wednesday. which bar graph could represent the ticket sales?
Answer
Explanation:
Step1: Identify key information
Wednesday: 500 tickets. Thursday and Friday > 1000 tickets. Wednesday > Monday + Tuesday.
Step2: Analyze option A
In A, Wednesday is not more than Monday + Tuesday.
Step3: Analyze option B
In B, Wednesday is not more than Monday + Tuesday.
Step4: Analyze option C
In C, Wednesday is more than Monday + Tuesday, and Thursday and Friday are more than Wednesday.
Step5: Analyze option D
In D, Thursday and Friday are not more than Wednesday.
Answer:
C.