a manufacturer created the table below as part of a program aimed to reduce manufacturing costs. the table…
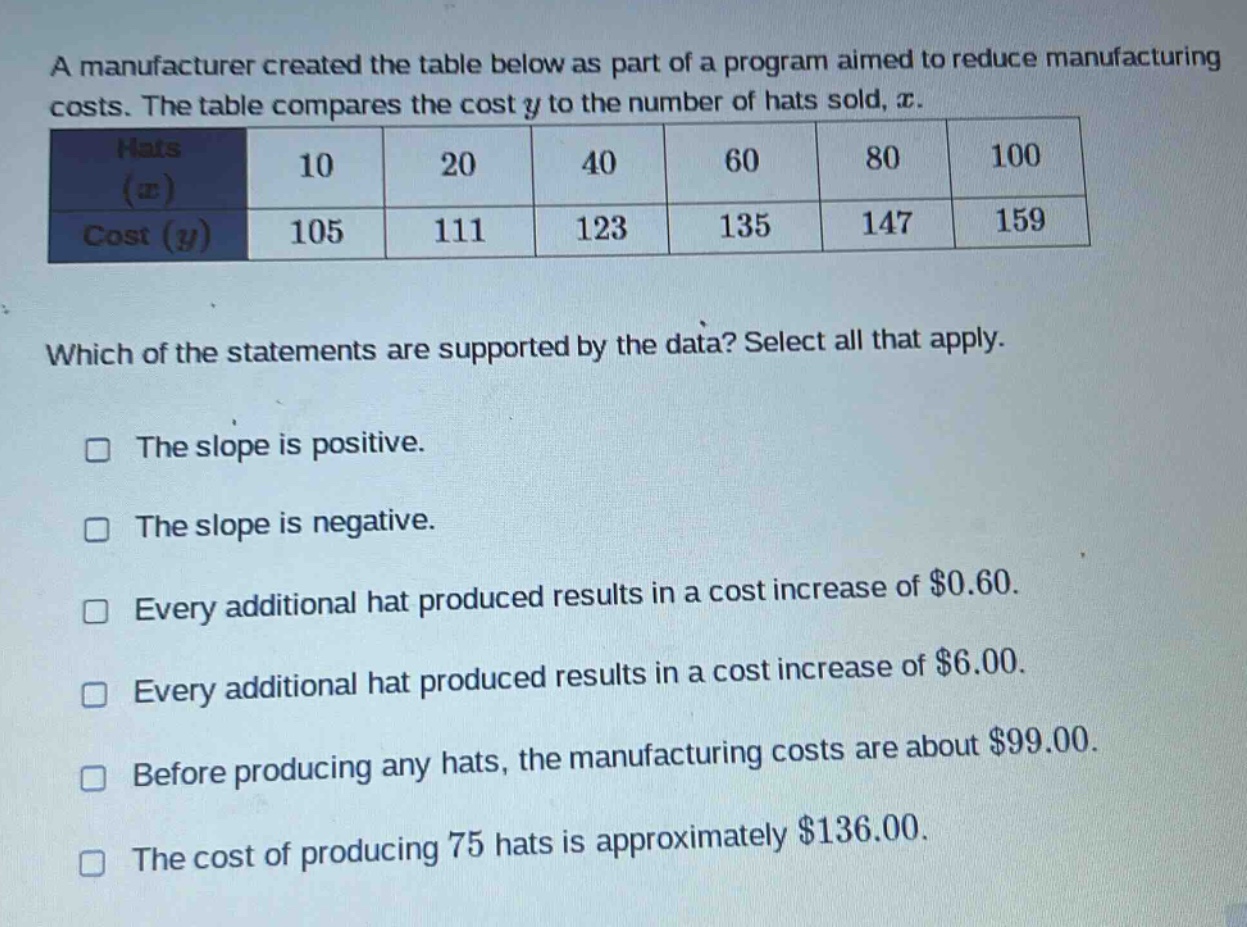
a manufacturer created the table below as part of a program aimed to reduce manufacturing costs. the table compares the cost $y$ to the number of hats sold, $x$.\n| hats ($x$) | 10 | 20 | 40 | 60 | 80 | 100 |\n| cost ($y$) | 105 | 111 | 123 | 135 | 147 | 159 |\nwhich of the statements are supported by the data? select all that apply.\n□ the slope is positive.\n□ the slope is negative.\n□ every additional hat produced results in a cost increase of $0.60.\n□ every additional hat produced results in a cost increase of $6.00.\n□ before producing any hats, the manufacturing costs are about $99.00.\n□ the cost of producing 75 hats is approximately $136.00.
Answer
Explanation:
Step1: Calculate the slope using two - point formula
The slope formula is $m=\frac{y_2 - y_1}{x_2 - x_1}$. Let's take two points $(x_1,y_1)=(10,105)$ and $(x_2,y_2)=(20,111)$. Then $m=\frac{111 - 105}{20 - 10}=\frac{6}{10}=0.6$. Since the slope $m = 0.6>0$, the slope is positive.
Step2: Interpret the slope
The slope $m = 0.6$ means that for every additional hat produced (increase in $x$ by 1), the cost $y$ increases by $0.6$ dollars.
Step3: Find the y - intercept (cost when $x = 0$)
We use the point - slope form $y - y_1=m(x - x_1)$. Using the point $(10,105)$ and $m = 0.6$, we have $y-105 = 0.6(x - 10)$. Expanding gives $y-105=0.6x - 6$, or $y=0.6x+99$. When $x = 0$, $y = 99$, so the manufacturing cost before producing any hats is about $$99$.
Step4: Estimate the cost for 75 hats
Using the equation $y=0.6x + 99$, when $x = 75$, $y=0.6\times75+99=45 + 99=144\neq136$.
Answer:
The slope is positive. Every additional hat produced results in a cost increase of $$0.60$. Before producing any hats, the manufacturing costs are about $$99.00$.