patient wait times on 9/12/12\nthe chart here shows the average patient wait times in a doctors office on a…
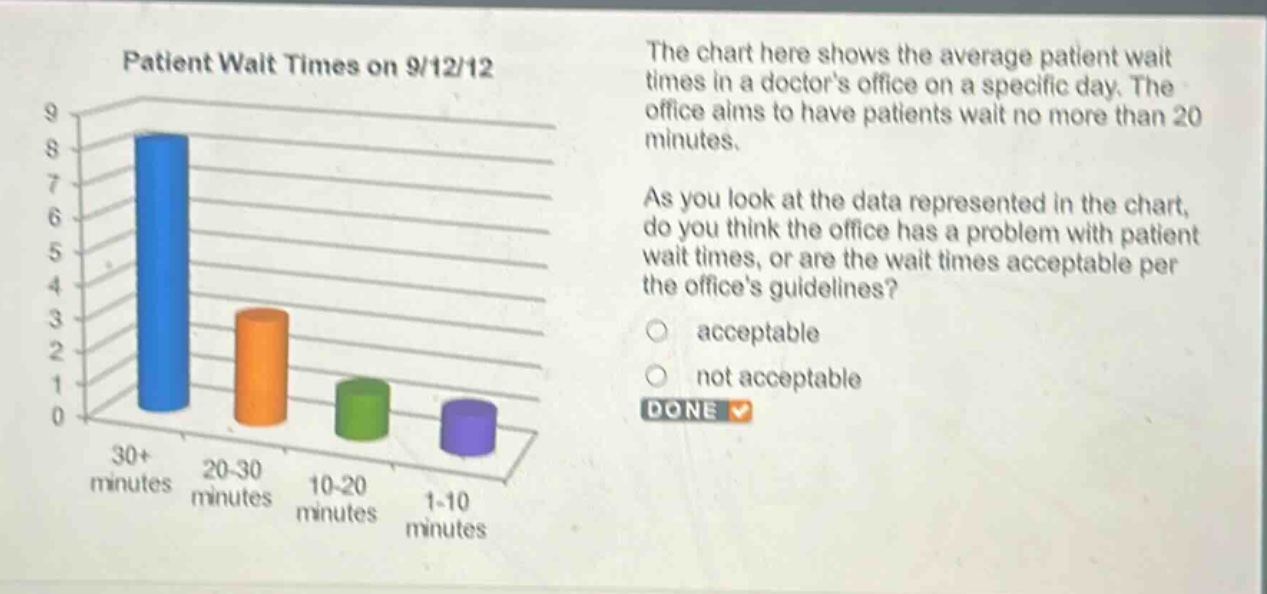
patient wait times on 9/12/12\nthe chart here shows the average patient wait times in a doctors office on a specific day. the office aims to have patients wait no more than 20 minutes.\nas you look at the data represented in the chart, do you think the office has a problem with patient wait times, or are the wait times acceptable per the offices guidelines?\nacceptable\nnot acceptable\ndone
Answer
Explanation:
Step1: Analyze the wait - time categories
The office's guideline is a maximum wait time of 20 minutes. The categories are 30+ minutes, 20 - 30 minutes, 10 - 20 minutes, and 1 - 10 minutes.
Step2: Check non - compliant categories
The categories 30+ minutes and 20 - 30 minutes represent wait times that exceed the 20 - minute guideline.
Answer:
not acceptable