what is pictured in the image? work is always late work area small no storage space people joe lacks…
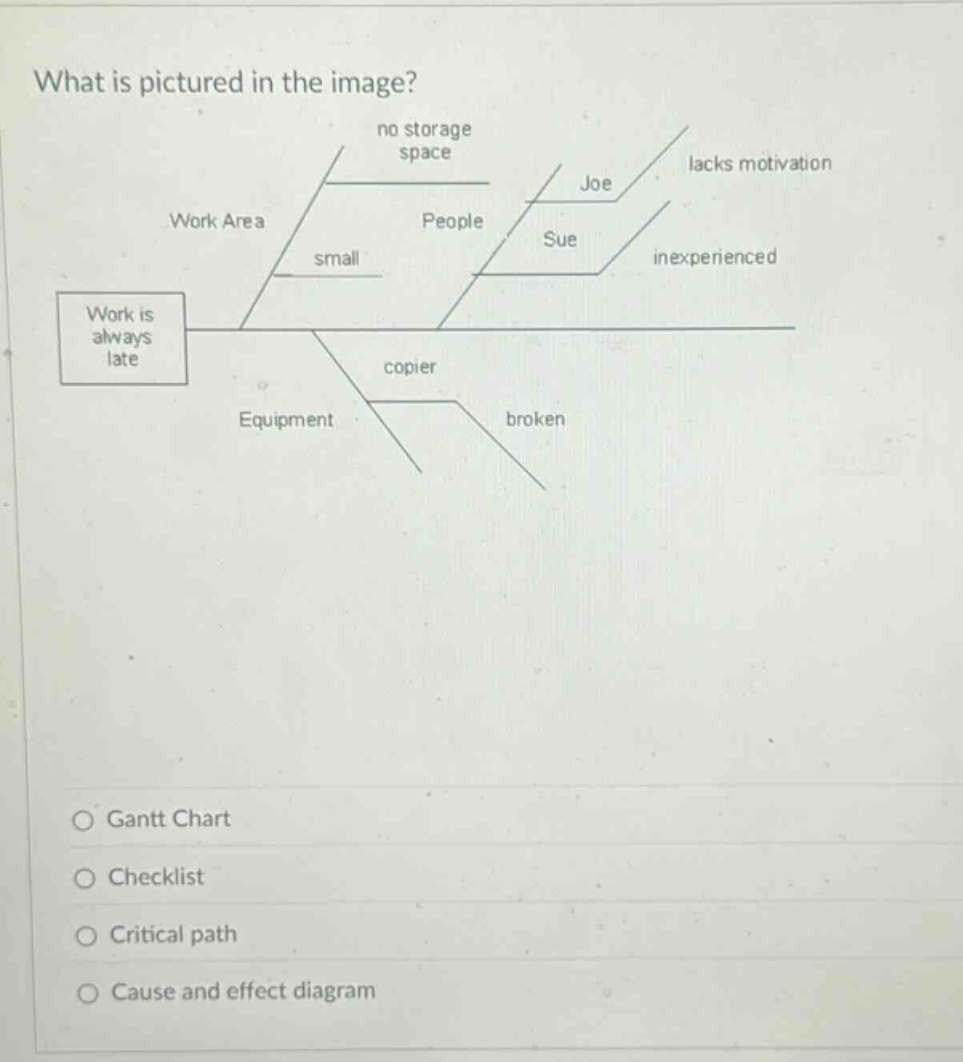
what is pictured in the image? work is always late work area small no storage space people joe lacks motivation sue inexperienced equipment copier broken gantt chart checklist critical path cause and effect diagram
Answer
Brief Explanations:
A cause - and - effect diagram, also known as a fishbone diagram, shows the potential causes of a problem. Here, the problem is "Work is always late" and the diagram lists causes under categories like Work Area, People, and Equipment. A Gantt chart is for scheduling tasks over time, a checklist is for listing items to be completed or verified, and a critical path is for identifying the longest sequence of tasks in a project schedule. This diagram fits the cause - and - effect diagram concept.
Answer:
D. Cause and effect diagram