pr 6 - 3a break - even sales and cost - volume - profit chart\nfor the coming year, cleves company…
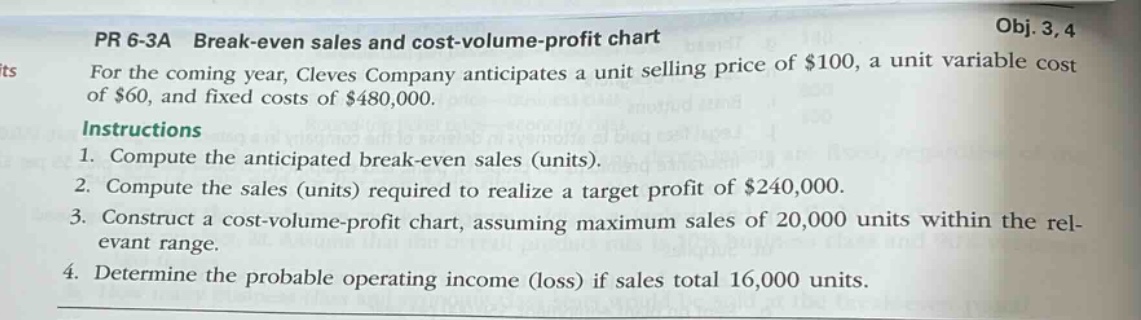
pr 6 - 3a break - even sales and cost - volume - profit chart\nfor the coming year, cleves company anticipates a unit selling price of $100, a unit variable cost of $60, and fixed costs of $480,000.\ninstructions\n1. compute the anticipated break - even sales (units).\n2. compute the sales (units) required to realize a target profit of $240,000.\n3. construct a cost - volume - profit chart, assuming maximum sales of 20,000 units within the relevant range.\n4. determine the probable operating income (loss) if sales total 16,000 units.
Answer
Explanation:
Step1: Calculate break - even units
The formula for break - even units is $\text{Break - even units}=\frac{\text{Fixed Costs}}{\text{Unit Selling Price}-\text{Unit Variable Cost}}$. Given fixed costs of $$480,000$, unit selling price of $$100$ and unit variable cost of $$60$. $\text{Break - even units}=\frac{480000}{100 - 60}=\frac{480000}{40}=12000$
Step2: Calculate units for target profit
The formula for units to reach target profit is $\text{Units}=\frac{\text{Fixed Costs}+\text{Target Profit}}{\text{Unit Selling Price}-\text{Unit Variable Cost}}$. Fixed costs are $$480,000$, target profit is $$240,000$, unit selling price is $$100$ and unit variable cost is $$60$. $\text{Units}=\frac{480000 + 240000}{100 - 60}=\frac{720000}{40}=18000$
Step3: Cost - volume - profit chart construction (conceptual steps)
- Fixed cost line: Fixed costs are $$480,000$. Draw a horizontal line at $y = 480000$ on the cost - volume - profit graph.
- Total cost line: The total cost formula is $TC=FC + VC$, where $FC = 480000$ and $VC = 60x$ ($x$ is the number of units). So $TC=480000+60x$.
- Total revenue line: The total revenue formula is $TR = 100x$. Plot $TR$ and $TC$ for $x$ from $0$ to $20000$ units. The break - even point is where $TR = TC$.
Step4: Calculate operating income for 16000 units
The formula for operating income is $OI=TR - TC$. $TR=\text{Unit Selling Price}\times\text{Number of Units}=100\times16000 = 1600000$. $TC=\text{Fixed Costs}+\text{Unit Variable Cost}\times\text{Number of Units}=480000+60\times16000=480000 + 960000=1440000$. $OI=1600000-1440000 = 160000$
Answer:
- 12000 units
- 18000 units
- (Constructed as described above)
- $$160,000$