question 3 of 10 olivia needs to provide a summary of her company’s expenses in different categories. which…
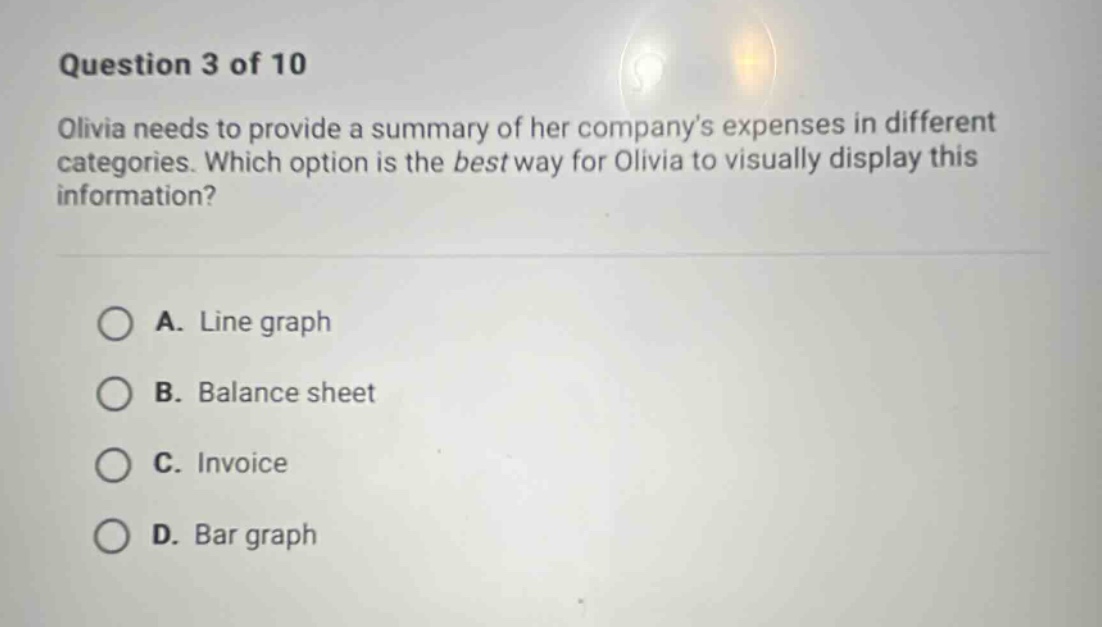
question 3 of 10 olivia needs to provide a summary of her company’s expenses in different categories. which option is the best way for olivia to visually display this information? a. line graph b. balance sheet c. invoice d. bar graph
Answer
Brief Explanations:
A line graph is for showing trends over time. A balance - sheet shows financial position at a point in time. An invoice is for billing. A bar graph is ideal for comparing amounts across different categories, which is suitable for showing company expenses in different categories.
Answer:
D. Bar graph