read the graph. what can the reader conclude from the graph? average survival rate of new businesses in the…
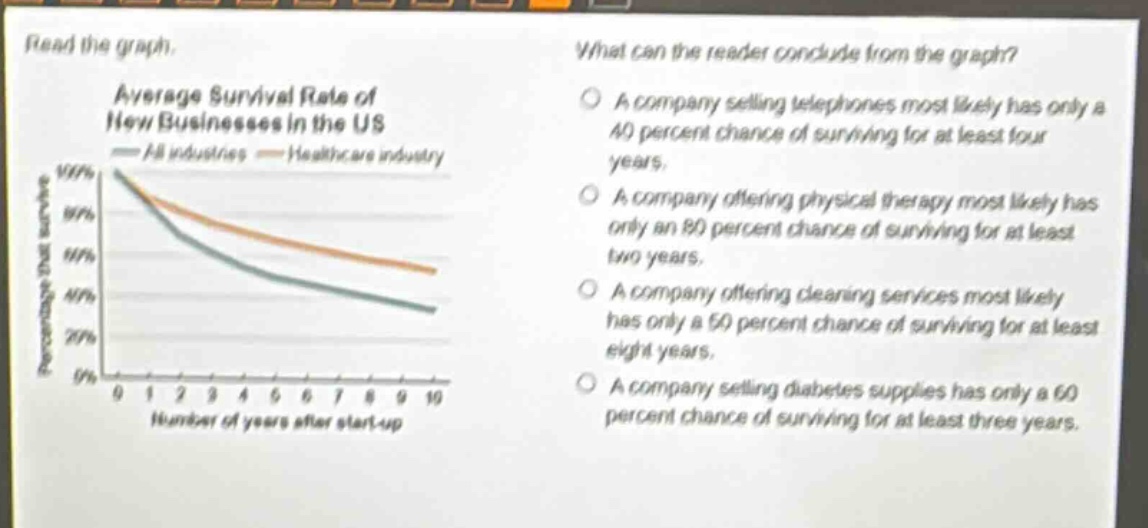
read the graph. what can the reader conclude from the graph? average survival rate of new businesses in the us all industries healthcare industry a company selling telephones most likely has only a 40 percent chance of surviving for at least four years. a company offering physical therapy most likely has only an 80 percent chance of surviving for at least two years. a company offering cleaning services most likely has only a 50 percent chance of surviving for at least eight years. a company selling diabetes supplies has only a 60 percent chance of surviving for at least three years.
Answer
Answer:
D. A company selling diabetes supplies has only a 60 percent chance of surviving for at least three years.
Explanation:
Step1: Analyze the graph
The graph shows survival - rate of new businesses in all industries and healthcare industry over years.
Step2: Evaluate Option A
The graph doesn't specifically mention telephone - selling companies, so we can't conclude this.
Step3: Evaluate Option B
There is no information about physical - therapy companies, so we can't conclude this.
Step4: Evaluate Option C
There is no information about cleaning - services companies, so we can't conclude this.
Step5: Evaluate Option D
Diabetes supplies are part of the healthcare industry. Looking at the healthcare industry line on the graph, at 3 years, the survival rate is around 60%, so this option is correct.