read the graph. what can the reader conclude from the graph? average survival rate of new businesses in the…
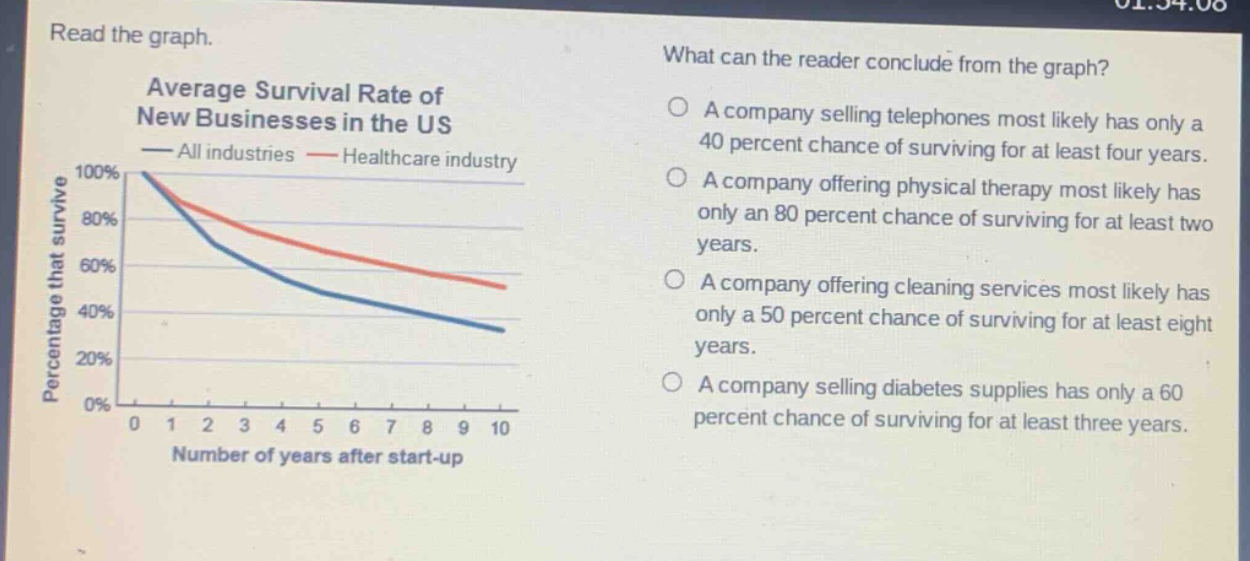
read the graph. what can the reader conclude from the graph? average survival rate of new businesses in the us all industries healthcare industry a company selling telephones most likely has only a 40 percent chance of surviving for at least four years. a company offering physical therapy most likely has only an 80 percent chance of surviving for at least two years. a company offering cleaning services most likely has only a 50 percent chance of surviving for at least eight years. a company selling diabetes supplies has only a 60 percent chance of surviving for at least three years. percentage that survive 100% 80% 60% 40% 20% 0% 0 1 2 3 4 5 6 7 8 9 10 number of years after start - up
Answer
Brief Explanations:
- Analyze each option against the graph:
- For selling telephones (not healthcare - all industries line), at 4 years, survival rate is below 40%.
- For physical therapy (healthcare industry), at 2 years, survival rate is above 80%.
- For cleaning services (all industries), at 8 years, survival rate is below 50%.
- For selling diabetes supplies (healthcare industry), at 3 years, survival rate is around 60%.
Answer:
D. A company selling diabetes supplies has only a 60 percent chance of surviving for at least three years.