select the correct answer from each drop - down menu. the graph shows the total cost (y) of producing x…
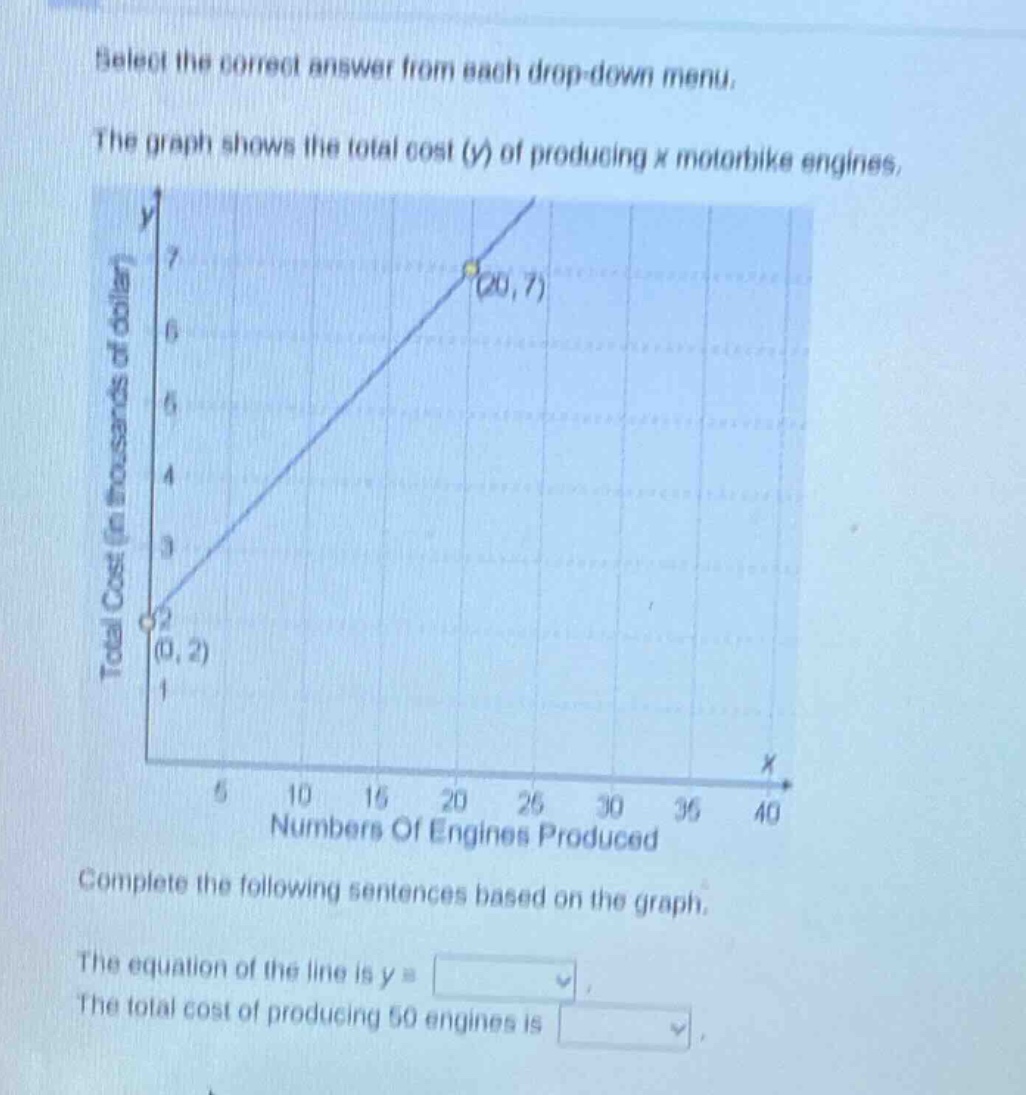
select the correct answer from each drop - down menu. the graph shows the total cost (y) of producing x motorbike engines. complete the following sentences based on the graph. the equation of the line is y = . the total cost of producing 50 engines is .
Answer
Explanation:
Step1: Identify two points from the graph.
The graph passes through the points $(0, 2)$ and $(20, 7)$.
Step2: Calculate the slope of the line.
The slope $m$ is given by the formula $m = \frac{y_2 - y_1}{x_2 - x_1}$. Using the points $(0, 2)$ and $(20, 7)$: $m = \frac{7 - 2}{20 - 0} = \frac{5}{20} = \frac{1}{4} = 0.25$
Step3: Determine the y-intercept.
The y-intercept is the point where the line crosses the y-axis. From the point $(0, 2)$, the y-intercept $b$ is $2$.
Step4: Write the equation of the line.
The equation of a line is $y = mx + b$. Substituting the values of $m$ and $b$: $y = 0.25x + 2$
Step5: Calculate the total cost of producing 50 engines.
Substitute $x = 50$ into the equation $y = 0.25x + 2$. $y = 0.25(50) + 2$ $y = 12.5 + 2$ $y = 14.5$ Since the total cost $y$ is in thousands of dollars, the cost is $14.5 \times 1000 = $14,500$.
Answer:
The equation of the line is $y = 0.25x + 2$ The total cost of producing 50 engines is $14,500