4. spike dykes operates the student foodservice in a dormitory at clairmont college. spike is interested in…
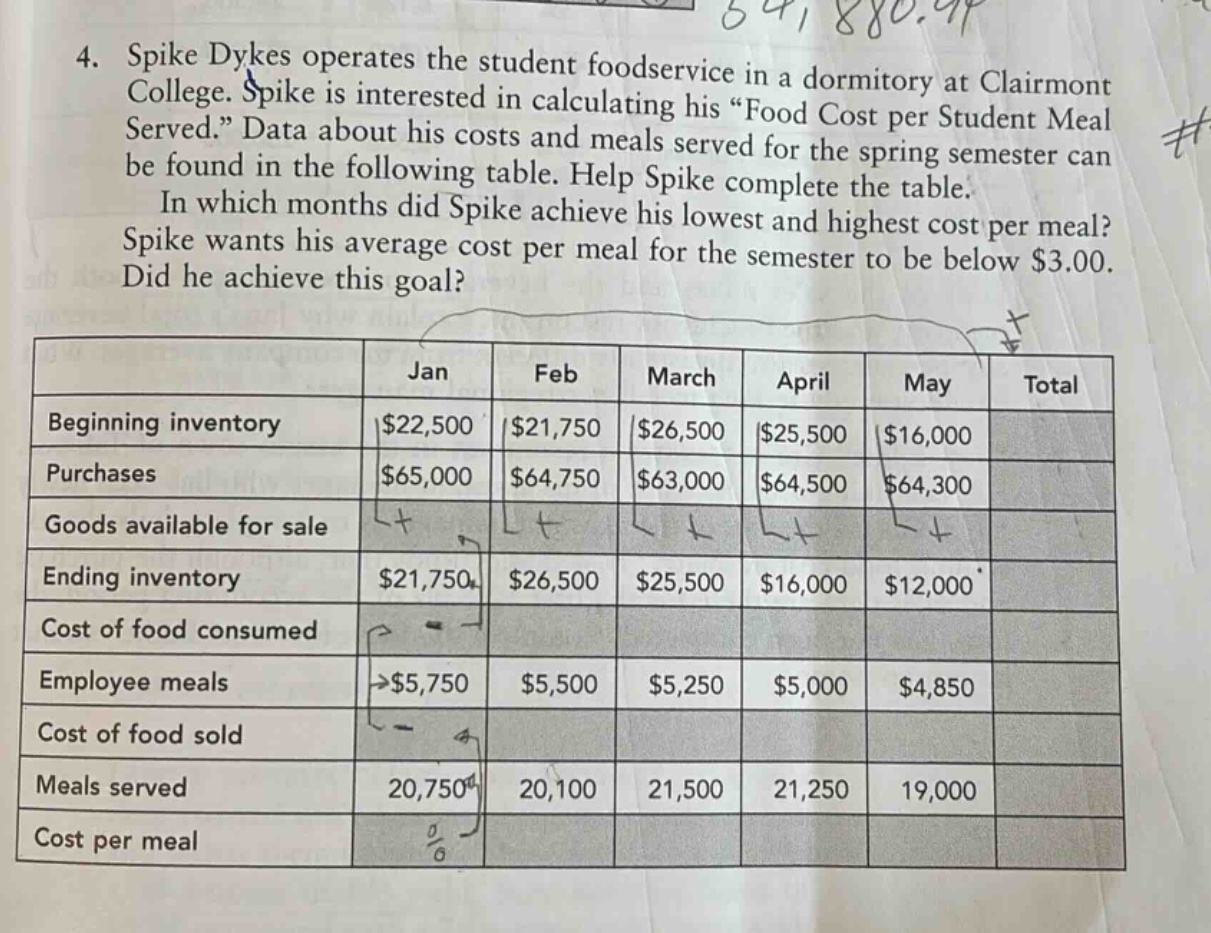
4. spike dykes operates the student foodservice in a dormitory at clairmont college. spike is interested in calculating his “food cost per student meal served.” data about his costs and meals served for the spring semester can be found in the following table. help spike complete the table. in which months did spike achieve his lowest and highest cost per meal? spike wants his average cost per meal for the semester to be below $3.00. did he achieve this goal? \n\n| | jan | feb | march | april | may | total |\n|--|--|--|--|--|--|--|\n| beginning inventory | $22,500 | $21,750 | $26,500 | $25,500 | $16,000 | \n| purchases | $65,000 | $64,750 | $63,000 | $64,500 | $64,300 | \n| goods available for sale | | | | | | \n| ending inventory | $21,750 | $26,500 | $25,500 | $16,000 | $12,000 | \n| cost of food consumed | | | | | | \n| employee meals | >$5,750 | $5,500 | $5,250 | $5,000 | $4,850 | \n| cost of food sold | | | | | | \n| meals served | 20,750 | 20,100 | 21,500 | 21,250 | 19,000 | \n| cost per meal | | | | | |
Answer
Explanation:
Step1: Calculate Goods available for sale
Goods available for sale = Beginning inventory + Purchases Jan: $22500 + 65000=87500$ Feb: $21750 + 64750 = 86500$ March: $26500+63000 = 89500$ April: $25500 + 64500=90000$ May: $16000+64300 = 80300$
Step2: Calculate Cost of food consumed
Cost of food consumed = Goods available for sale - Ending inventory Jan: $87500 - 21750=65750$ Feb: $86500 - 26500 = 60000$ March: $89500 - 25500=64000$ April: $90000 - 16000 = 74000$ May: $80300 - 12000=68300$
Step3: Calculate Cost of food sold
Cost of food sold = Cost of food consumed - Employee meals Jan: $65750-5750 = 60000$ Feb: $60000 - 5500=54500$ March: $64000 - 5250 = 58750$ April: $74000 - 5000=69000$ May: $68300 - 4850=63450$
Step4: Calculate Cost per meal
Cost per meal = Cost of food sold / Meals served Jan: $\frac{60000}{20750}\approx2.89$ Feb: $\frac{54500}{20100}\approx2.71$ March: $\frac{58750}{21500}\approx2.73$ April: $\frac{69000}{21250}=3.25$ May: $\frac{63450}{19000}\approx3.34$
Step5: Find lowest and highest cost - per - meal months
The lowest cost per meal is in February ($2.71$) and the highest cost per meal is in May ($3.34$)
Step6: Calculate average cost per meal for the semester
Total cost of food sold = $60000 + 54500+58750+69000+63450=305700$ Total meals served = $20750 + 20100+21500+21250+19000 = 102600$ Average cost per meal = $\frac{305700}{102600}\approx2.98$
Since $2.98<3.00$, Spike achieved his goal.
Answer:
Lowest cost per meal month: February Highest cost per meal month: May Did he achieve his goal: Yes