a sporting goods store uses quadratic equations to monitor the daily cost and profit for various items it…
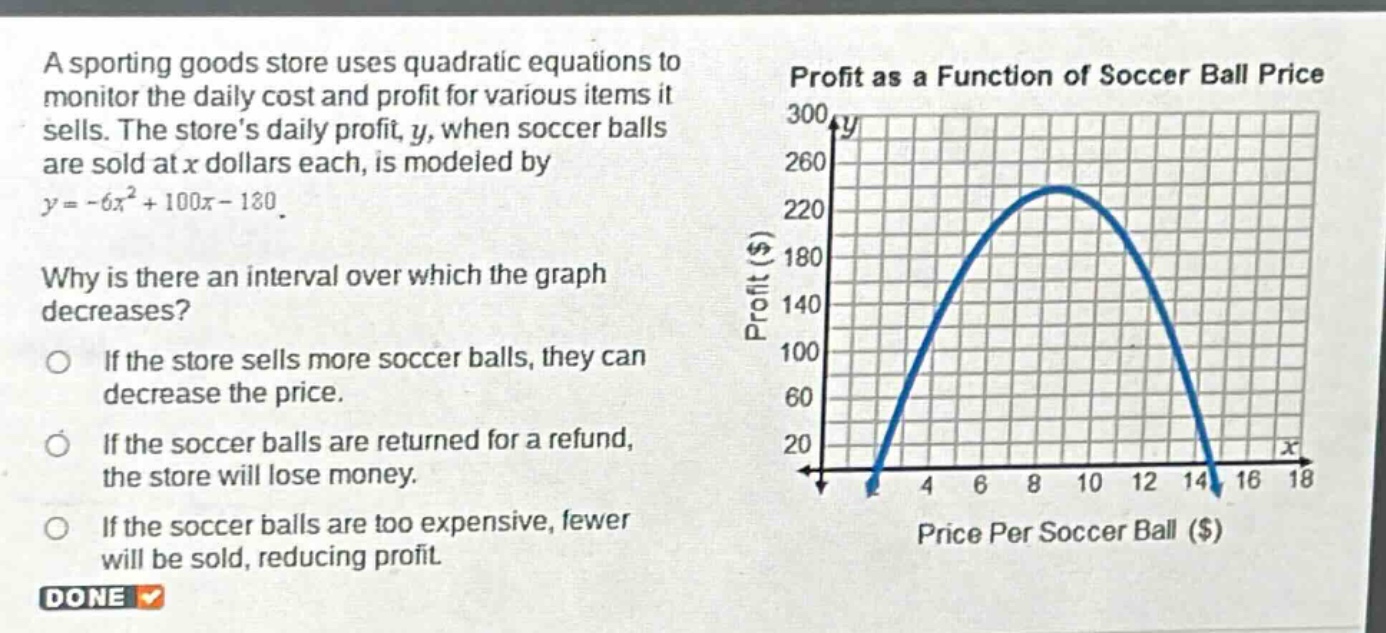
a sporting goods store uses quadratic equations to monitor the daily cost and profit for various items it sells. the stores daily profit, y, when soccer balls are sold at x dollars each, is modeled by y = -6x² + 100x - 180. why is there an interval over which the graph decreases? if the store sells more soccer balls, they can decrease the price. if the soccer balls are returned for a refund, the store will lose money. if the soccer balls are too expensive, fewer will be sold, reducing profit.
Answer
Brief Explanations:
The profit - price relationship is modeled by a quadratic function. In a business context, when the price of a product (soccer balls here) is too high, demand decreases. Fewer sales lead to lower profit, causing the profit - price graph to decrease over a certain price interval.
Answer:
If the soccer balls are too expensive, fewer will be sold, reducing profit.