study the graph carefully. which of the following statements is true? the graph is drawn correctly. the…
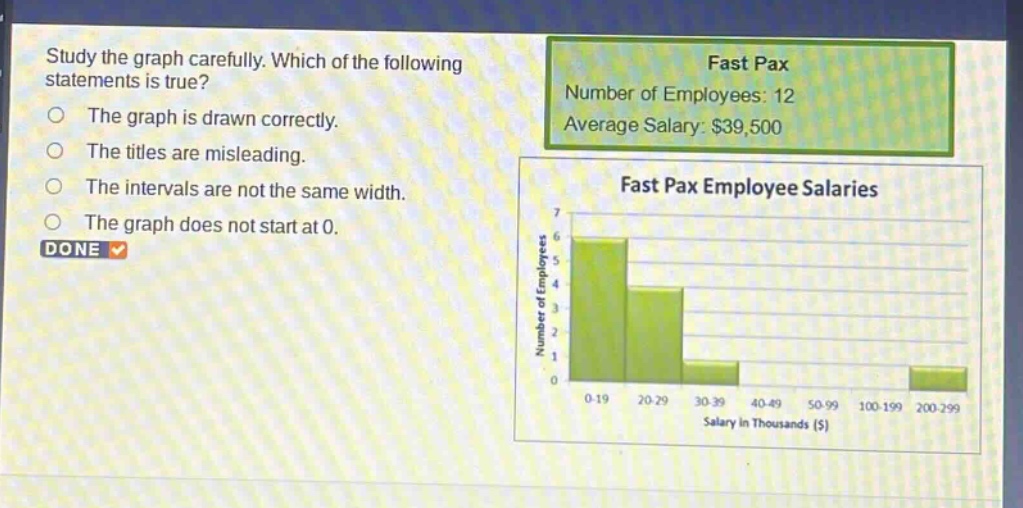
study the graph carefully. which of the following statements is true? the graph is drawn correctly. the titles are misleading. the intervals are not the same width. the graph does not start at 0. done fast pax number of employees: 12 average salary: $39,500 fast pax employee salaries
Answer
Explanation:
Step1: Analyze graph - start point
Check if the y - axis (number of employees) starts at 0. It does. Check if the x - axis (salary in thousands) starts at 0. It does.
Step2: Analyze graph - intervals
The intervals on the x - axis are: 0 - 19, 20 - 29, 30 - 39, 40 - 49, 50 - 99, 100 - 199, 200 - 299. The widths are not the same. For example, 0 - 19 has a width of 20, 20 - 29 has a width of 10, 50 - 99 has a width of 50 etc.
Step3: Analyze graph - titles
There is no indication that the titles "Fast Pax Employee Salaries" and the boxed information about number of employees and average salary are misleading.
Step4: Analyze graph - correctness
Since the intervals are not of the same width, the graph is not drawn correctly according to proper graph - making conventions.
Answer:
The intervals are not the same width.