how do you see it? the manager of a company sees the graph shown and concludes that the company is…
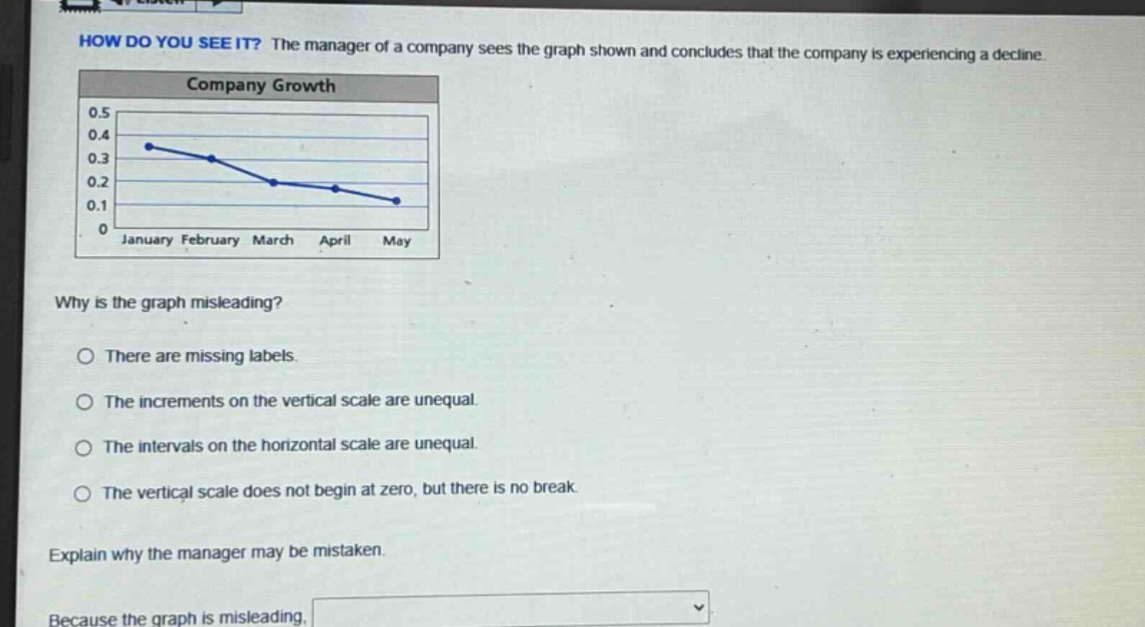
how do you see it? the manager of a company sees the graph shown and concludes that the company is experiencing a decline. company growth 0.5 0.4 0.3 0.2 0.1 0 january february march april may why is the graph misleading? there are missing labels. the increments on the vertical scale are unequal. the intervals on the horizontal scale are unequal. the vertical scale does not begin at zero, but there is no break. explain why the manager may be mistaken. because the graph is misleading.
Answer
Brief Explanations:
El gráfico de crecimiento de la empresa tiene una escala vertical que no comienza en cero y carece de una marca de ruptura. Esto puede exagerar la apariencia de una declive. Las variaciones en los valores pueden parecer más significativas de lo que realmente son.
Answer:
The vertical scale does not begin at zero, but there is no break.