zachary is analyzing his restaurants income to see if there is a relationship between the outdoor…
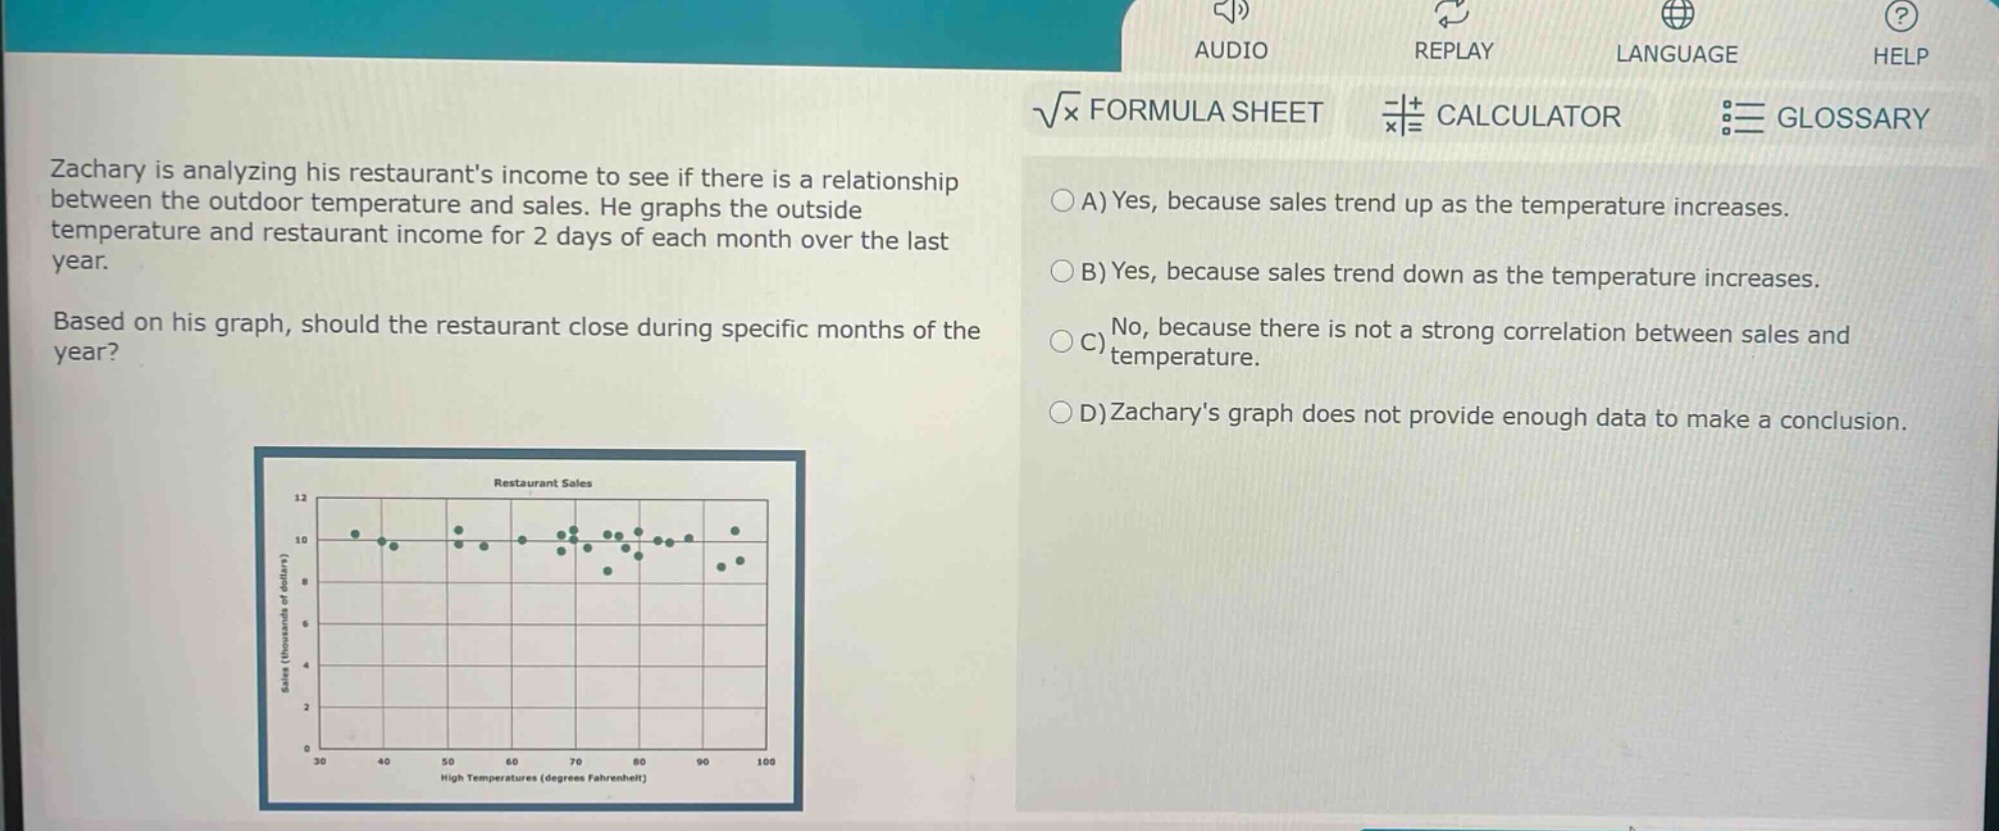
zachary is analyzing his restaurants income to see if there is a relationship between the outdoor temperature and sales. he graphs the outside temperature and restaurant income for 2 days of each month over the last year. based on his graph, should the restaurant close during specific months of the year? a) yes, because sales trend up as the temperature increases. b) yes, because sales trend down as the temperature increases. c) no, because there is not a strong correlation between sales and temperature. d) zacharys graph does not provide enough data to make a conclusion.
Answer
Explanation:
Step1: Observe the scatter - plot
The points on the scatter - plot of temperature and sales are randomly scattered. There is no clear upward or downward trend.
Step2: Analyze correlation
Since there is no clear pattern of sales increasing or decreasing with temperature changes, there is not a strong correlation between sales and temperature.
Answer:
C) No, because there is not a strong correlation between sales and temperature.