the chart shows the solubility of different substances. which statement is represented by the graph…
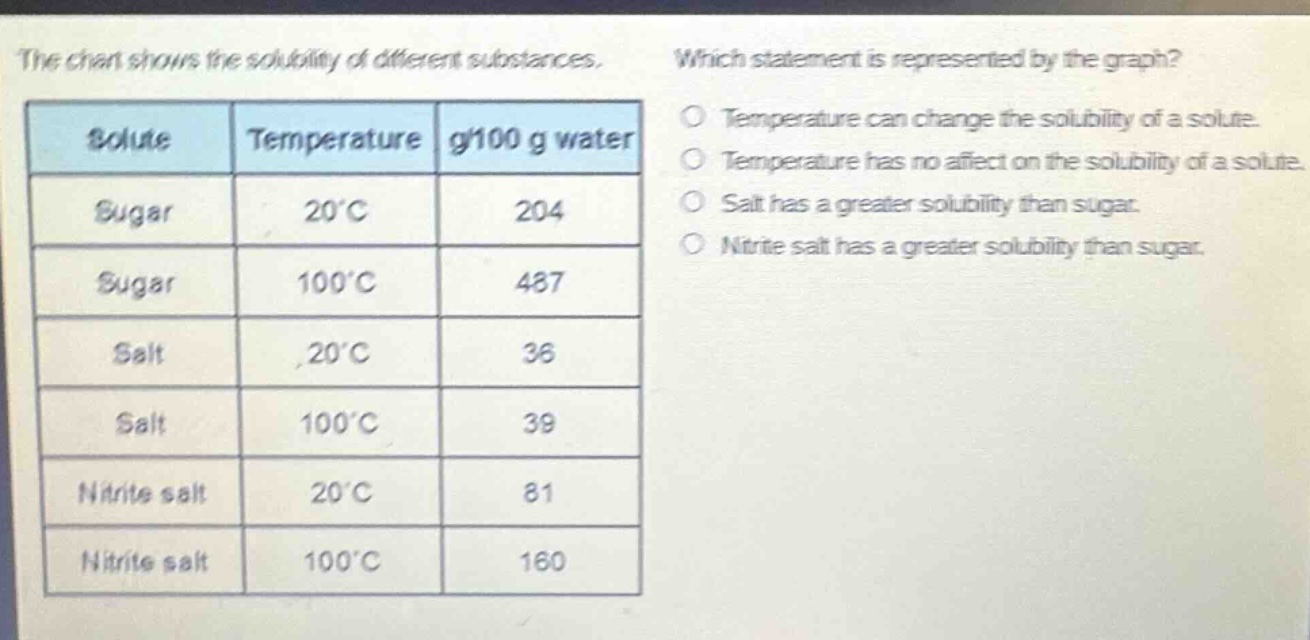
the chart shows the solubility of different substances. which statement is represented by the graph? temperature can change the solubility of a solute. temperature has no affect on the solubility of a solute. salt has a greater solubility than sugar. nitrite salt has a greater solubility than sugar. solute temperature g/100 g water sugar 20°c 204 sugar 100°c 487 salt 20°c 36 salt 100°c 39 nitrite salt 20°c 81 nitrite salt 100°c 160
Answer
Explanation:
Step1: Analyze sugar solubility
For sugar, at 20°C solubility is 204 g/100 g water and at 100°C it is 487 g/100 g water. Solubility increases with temperature.
Step2: Analyze salt solubility
For salt, at 20°C solubility is 36 g/100 g water and at 100°C it is 39 g/100 g water. Solubility slightly increases with temperature.
Step3: Analyze nitrite - salt solubility
For nitrite - salt, at 20°C solubility is 81 g/100 g water and at 100°C it is 160 g/100 g water. Solubility increases with temperature.
Step4: Compare solubilities
At both 20°C and 100°C, sugar has higher solubility than salt and nitrite - salt. Also, solubility of all three substances changes with temperature.
Answer:
Temperature can change the solubility of a solute.