a data set of a graph has lines that are labeled every 0.1 moles. if the axis of the graph contains 15…
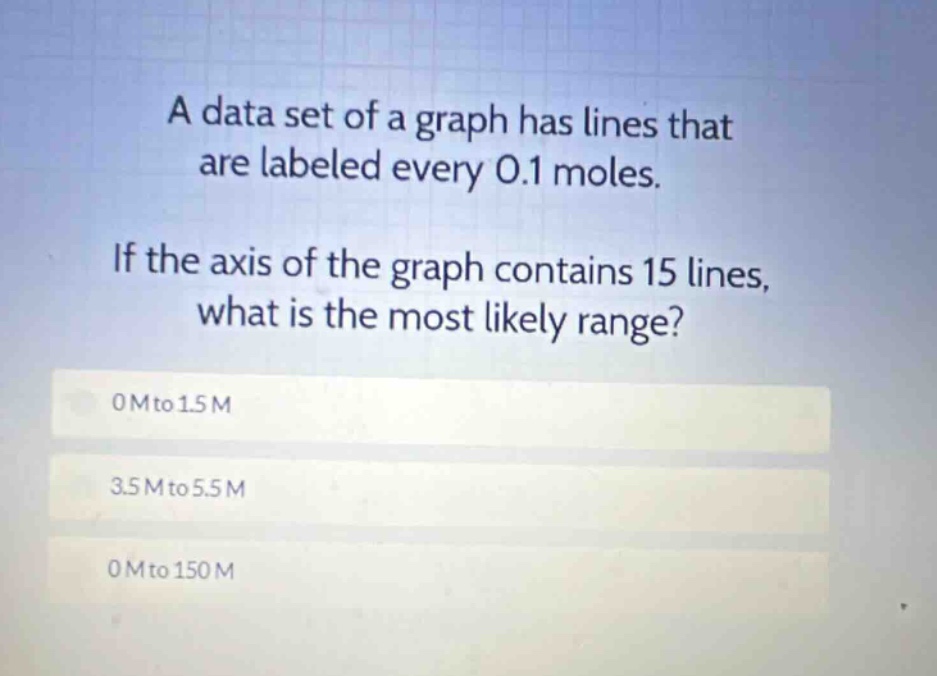
a data set of a graph has lines that are labeled every 0.1 moles. if the axis of the graph contains 15 lines, what is the most likely range? 0 m to 1.5 m 3.5 m to 5.5 m 0 m to 150 m
Answer
Explanation:
Step1: Determine the number of intervals
The number of intervals between 15 lines is 14.
Step2: Calculate the range
Since each interval is 0.1 moles, the range is $14\times0.1 = 1.4$ moles. Starting from 0, the range is from 0 to 1.4 (approx 1.5) moles.
Answer:
0 M to 1.5 M