the following diagram represents the potential energy for the reaction: heat + 2nh3(g) → n2(g) + 3h2(g) the…
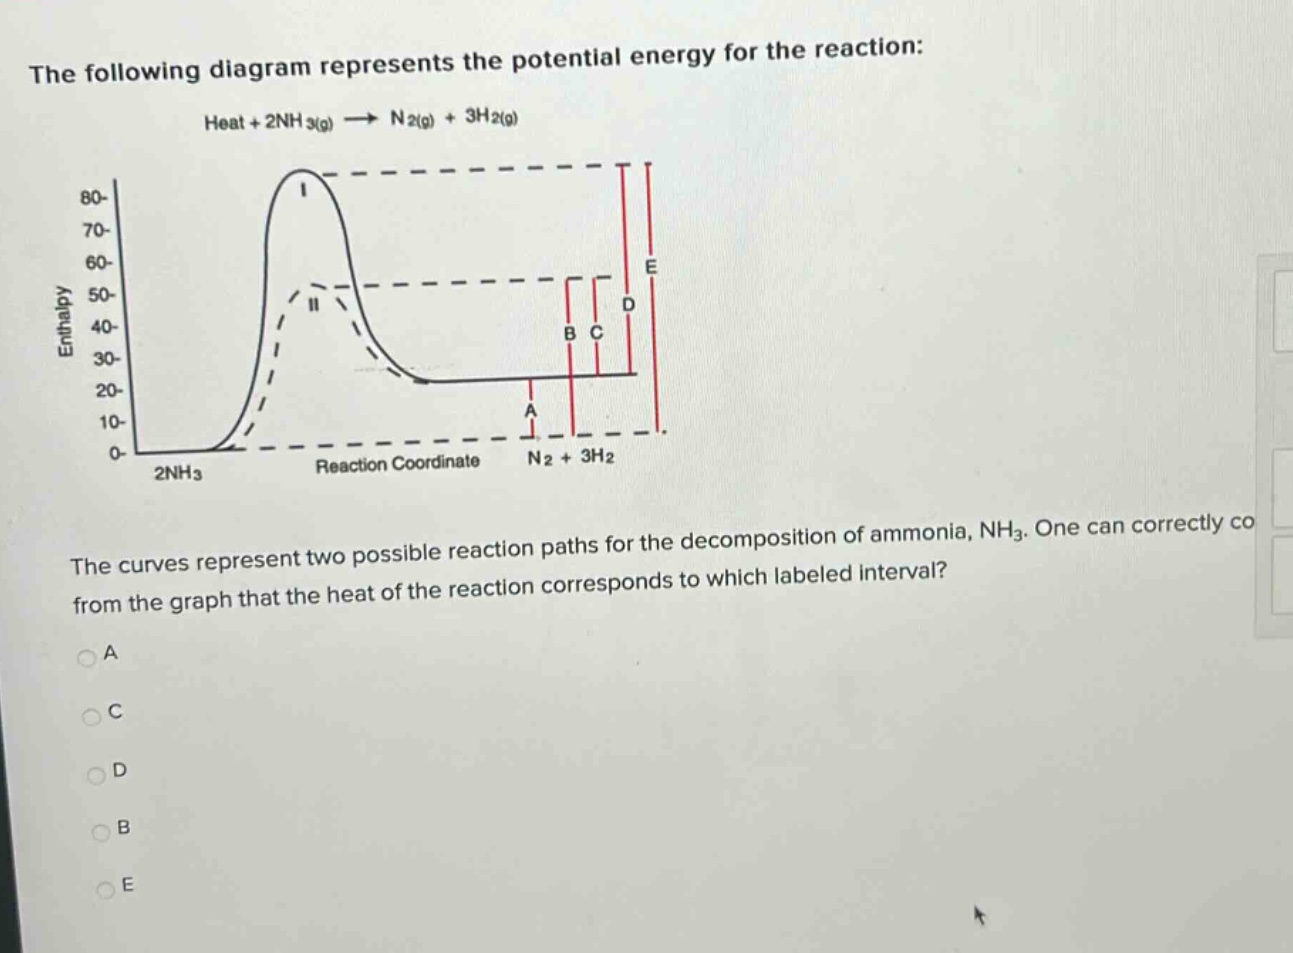
the following diagram represents the potential energy for the reaction: heat + 2nh3(g) → n2(g) + 3h2(g) the curves represent two possible reaction paths for the decomposition of ammonia, nh3. one can correctly co from the graph that the heat of the reaction corresponds to which labeled interval? a c d b e
Answer
Explanation:
Step1: Recall heat - of - reaction definition
The heat of reaction ($\Delta H$) is the difference in enthalpy between the products and the reactants.
Step2: Identify reactants and products on the graph
The reactant is $2NH_3$ and the products are $N_2 + 3H_2$. The enthalpy of the reactants is at the starting - point of the reaction coordinate and the enthalpy of the products is at the end - point of the reaction coordinate.
Step3: Determine the heat - of - reaction interval
The heat of reaction is the vertical distance between the enthalpy of the reactants and the enthalpy of the products. On the graph, this is represented by the interval A.
Answer:
A. A