which graph correctly depicts the relationship between number of moles of gas and volume when pressure and…
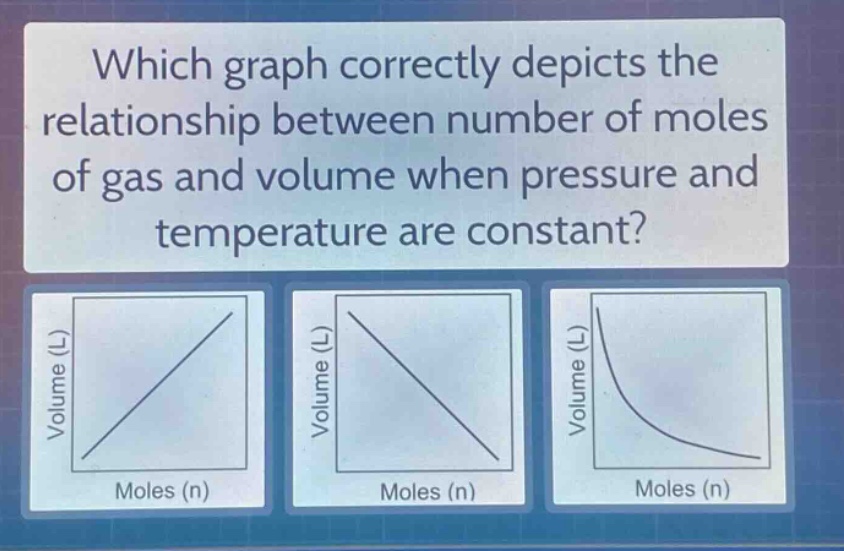
which graph correctly depicts the relationship between number of moles of gas and volume when pressure and temperature are constant?
Answer
Explanation:
Step1: Recall Avogadro's law
Avogadro's law states that at constant temperature and pressure, the volume ($V$) of a gas is directly proportional to the number of moles ($n$) of the gas. Mathematically, $V = kn$, where $k$ is a constant.
Step2: Analyze the graph - type for direct - proportion
A direct - proportion relationship between two variables $y$ and $x$ is represented by a straight - line graph passing through the origin ($y=mx$, where $m$ is the slope and when $x = 0$, $y = 0$). In the case of $V$ and $n$, as $n$ increases, $V$ increases linearly.
Answer:
The first graph (the one with a straight - line with a positive slope passing through the origin) correctly depicts the relationship.