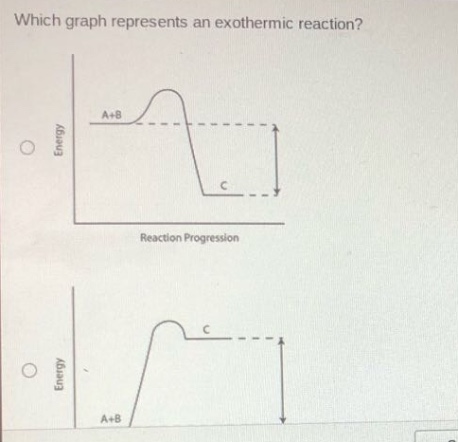
which graph represents an exothermic reaction?
which graph represents an exothermic reaction?
Answer
Answer:
The first graph.
Explanation:
Step1: Recall exothermic reaction concept
In an exothermic reaction, the products have lower energy than the reactants.
Step2: Analyze graphs
In the first graph, the energy of C (products) is lower than A + B (reactants). In the second graph, the energy of C (products) is higher than A + B (reactants), which represents an endothermic reaction.