the graph shows a heating curve of an unknown substance. what is happening to the substance between points 1…
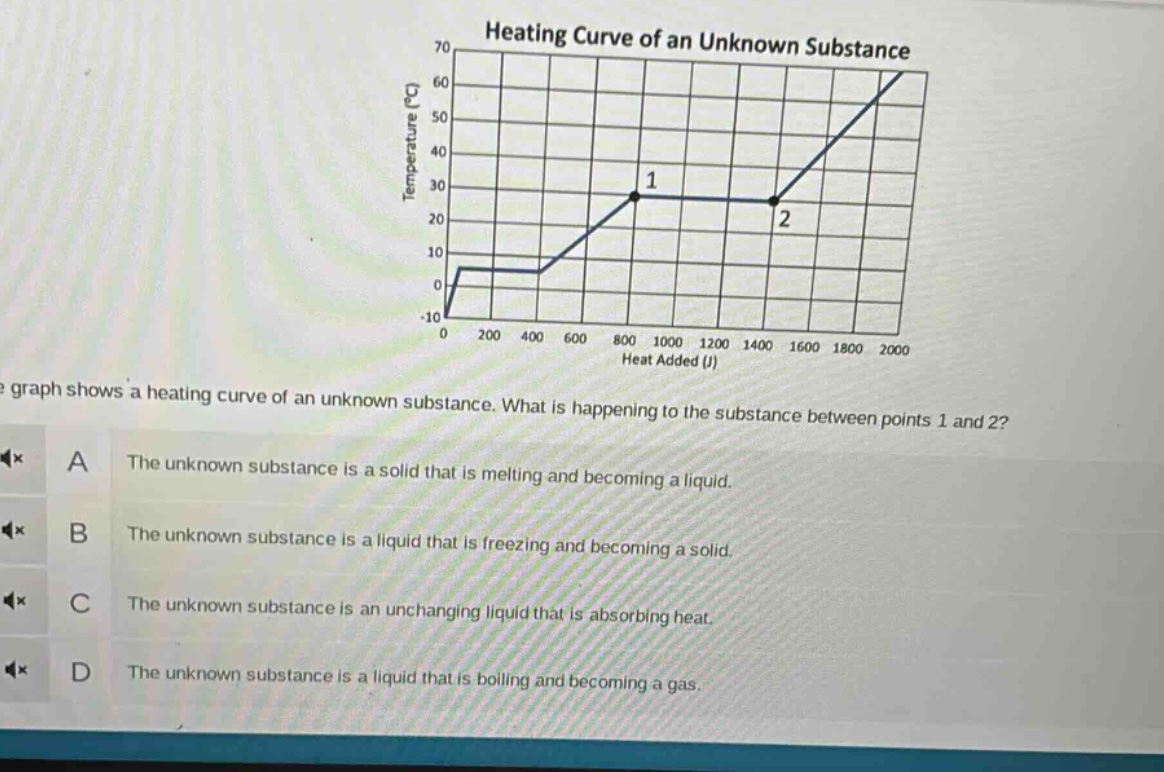
the graph shows a heating curve of an unknown substance. what is happening to the substance between points 1 and 2? a the unknown substance is a solid that is melting and becoming a liquid. b the unknown substance is a liquid that is freezing and becoming a solid. c the unknown substance is an unchanging liquid that is absorbing heat. d the unknown substance is a liquid that is boiling and becoming a gas.
Answer
Brief Explanations:
- A heating curve shows the phase changes of a substance as heat is added.
- Between points 1 and 2, the temperature remains constant while heat is being added. This is characteristic of a phase change.
- Since the substance is being heated (heat is added), it is moving from a lower - energy phase to a higher - energy phase.
- Melting (solid to liquid) occurs at a lower temperature range compared to boiling (liquid to gas). In this graph, the first flat - line (at a lower temperature) is likely melting, and the second flat - line (points 1 - 2) is boiling (liquid to gas as heat is continuously added and temperature is constant during the phase change).
Answer:
D. The unknown substance is a liquid that is boiling and becoming a gas.