the graph below shows how solubility changes with temperature.\nsolubility vs. temperature for a variety of…
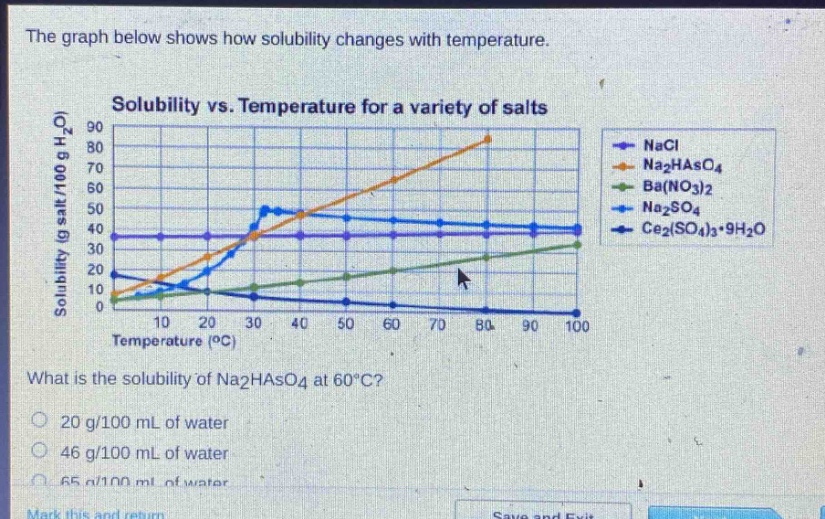
the graph below shows how solubility changes with temperature.\nsolubility vs. temperature for a variety of salts\nwhat is the solubility of na2haso4 at 60°c?\n20 g/100 ml of water\n46 g/100 ml of water\n65 g/100 ml of water
Answer
Explanation:
Step1: Locate the temperature
Find 60°C on the x - axis.
Step2: Locate the salt
Find the orange line representing $Na_2HAsO_4$.
Step3: Read the solubility
Read the y - value where the orange line intersects the 60°C mark on the x - axis. The y - value is 65 g/100 g $H_2O$.
Answer:
65 g/100 mL of water