what is missing from the solubility graph shown on the right? done
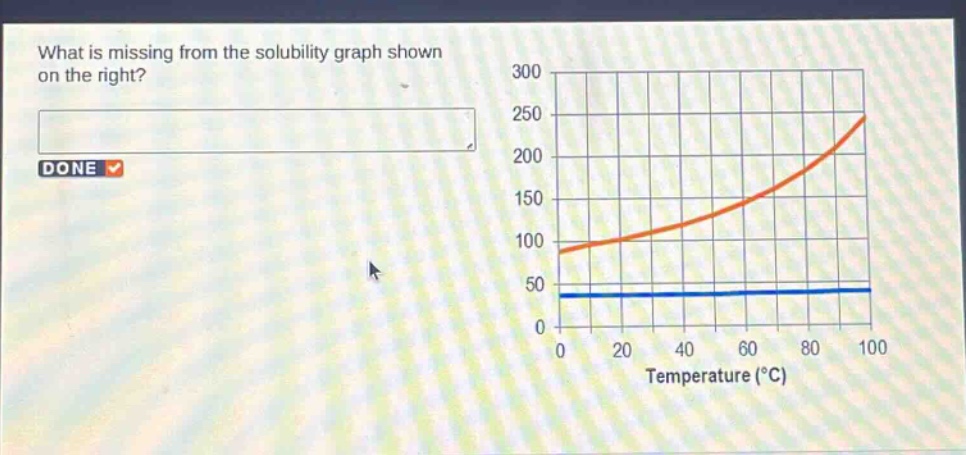
what is missing from the solubility graph shown on the right? done
Answer
Brief Explanations:
A solubility graph should have labels for the axes indicating what is being measured. Here, the x - axis is labeled as temperature, but the y - axis has no label. It should indicate the solubility (e.g., grams of solute per 100 grams of solvent).
Answer:
A label for the y - axis indicating the solubility measurement.