the ph of a particular solution is given by $ph = -\\log(x - 2)$, where $x$ represents the concentration of…
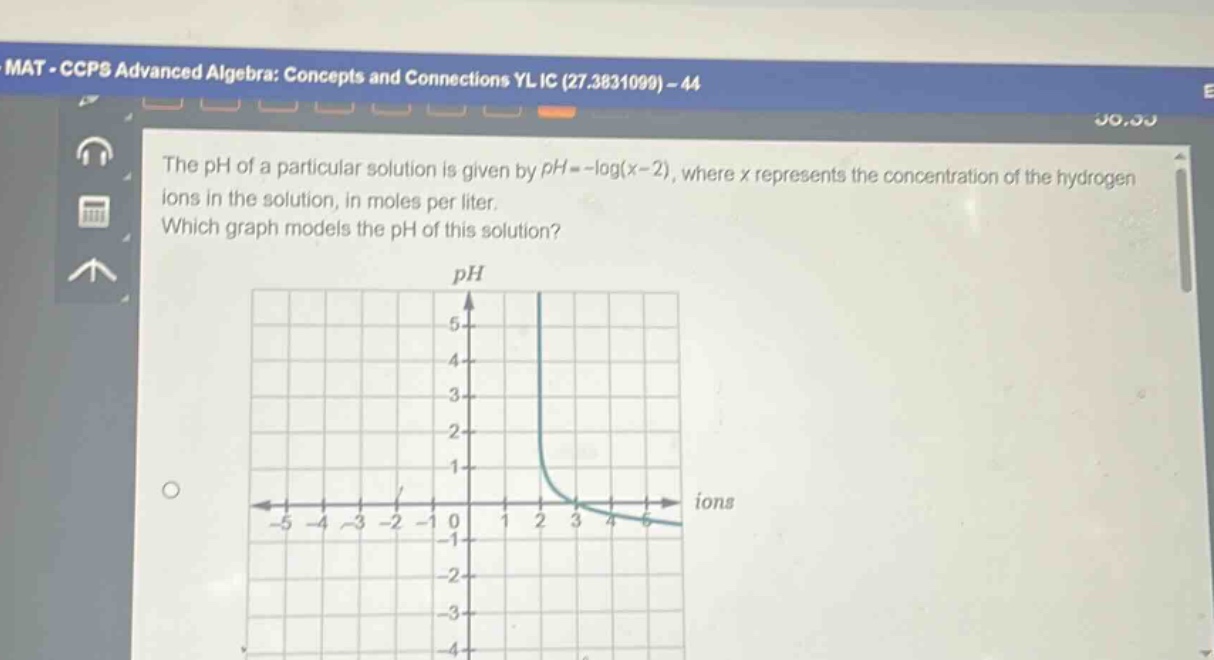
the ph of a particular solution is given by $ph = -\\log(x - 2)$, where $x$ represents the concentration of the hydrogen ions in the solution, in moles per liter. which graph models the ph of this solution?
Answer
Answer:
We need to analyze the function (y =-\log(x - 2)) to determine its graph.
- Domain:
- For the logarithm function (\log u), the argument (u=x - 2>0), so (x>2). The function is not defined for (x\leqslant2).
- Vertical - asymptote:
- As (x\to2^{+}), (u=x - 2\to0^{+}), and (\log(x - 2)\to-\infty), so (-\log(x - 2)\to+\infty). Thus, (x = 2) is a vertical asymptote.
- Intercepts:
- To find the (x) - intercept, set (y = 0). Then (0=-\log(x - 2)), which implies (\log(x - 2)=0). Since (\log1 = 0), we have (x-2 = 1), so (x=3).
- To find the (y) - intercept, set (x = 0). But (x = 0) is not in the domain of the function (y=-\log(x - 2)) since (0-2=-2<0).
- Shape of the graph:
- The function (y =-\log(x - 2)) is a transformation of the basic logarithmic function (y=\log x). The negative sign in front of the logarithm reflects the graph of (y = \log(x - 2)) about the (x) - axis. The graph of (y=\log(x - 2)) is the graph of (y=\log x) shifted 2 units to the right.
- The graph of (y =-\log(x - 2)) is a decreasing function for (x>2) (because the derivative of (y =-\log(x - 2)=-\frac{1}{(x - 2)\ln10}<0) for (x>2)).
Based on the above - mentioned properties (vertical asymptote at (x = 2), (x) - intercept at (x = 3), and the function is decreasing for (x>2)), we can analyze the given graph. If the graph has a vertical asymptote at (x = 2), passes through the point ((3,0)) and is decreasing for (x>2), then it is the correct graph of the function (y=-\log(x - 2)).
Since no other graphs are provided, we assume the given graph has these properties.
Explanation:
Step1: Determine the domain
The argument of the logarithm (x-2>0), so (x>2).
Step2: Find the vertical asymptote
As (x\to2^{+}), (-\log(x - 2)\to+\infty), so (x = 2) is a vertical asymptote.
Step3: Calculate the (x) - intercept
Set (y = 0), then (\log(x - 2)=0), so (x-2 = 1) and (x = 3).
Step4: Analyze the shape
The function is decreasing for (x>2) as its derivative is negative for (x>2).