the pressure on a sample of pure x held at 245. °c and 0.83 atm is increased until the sample condenses. the…
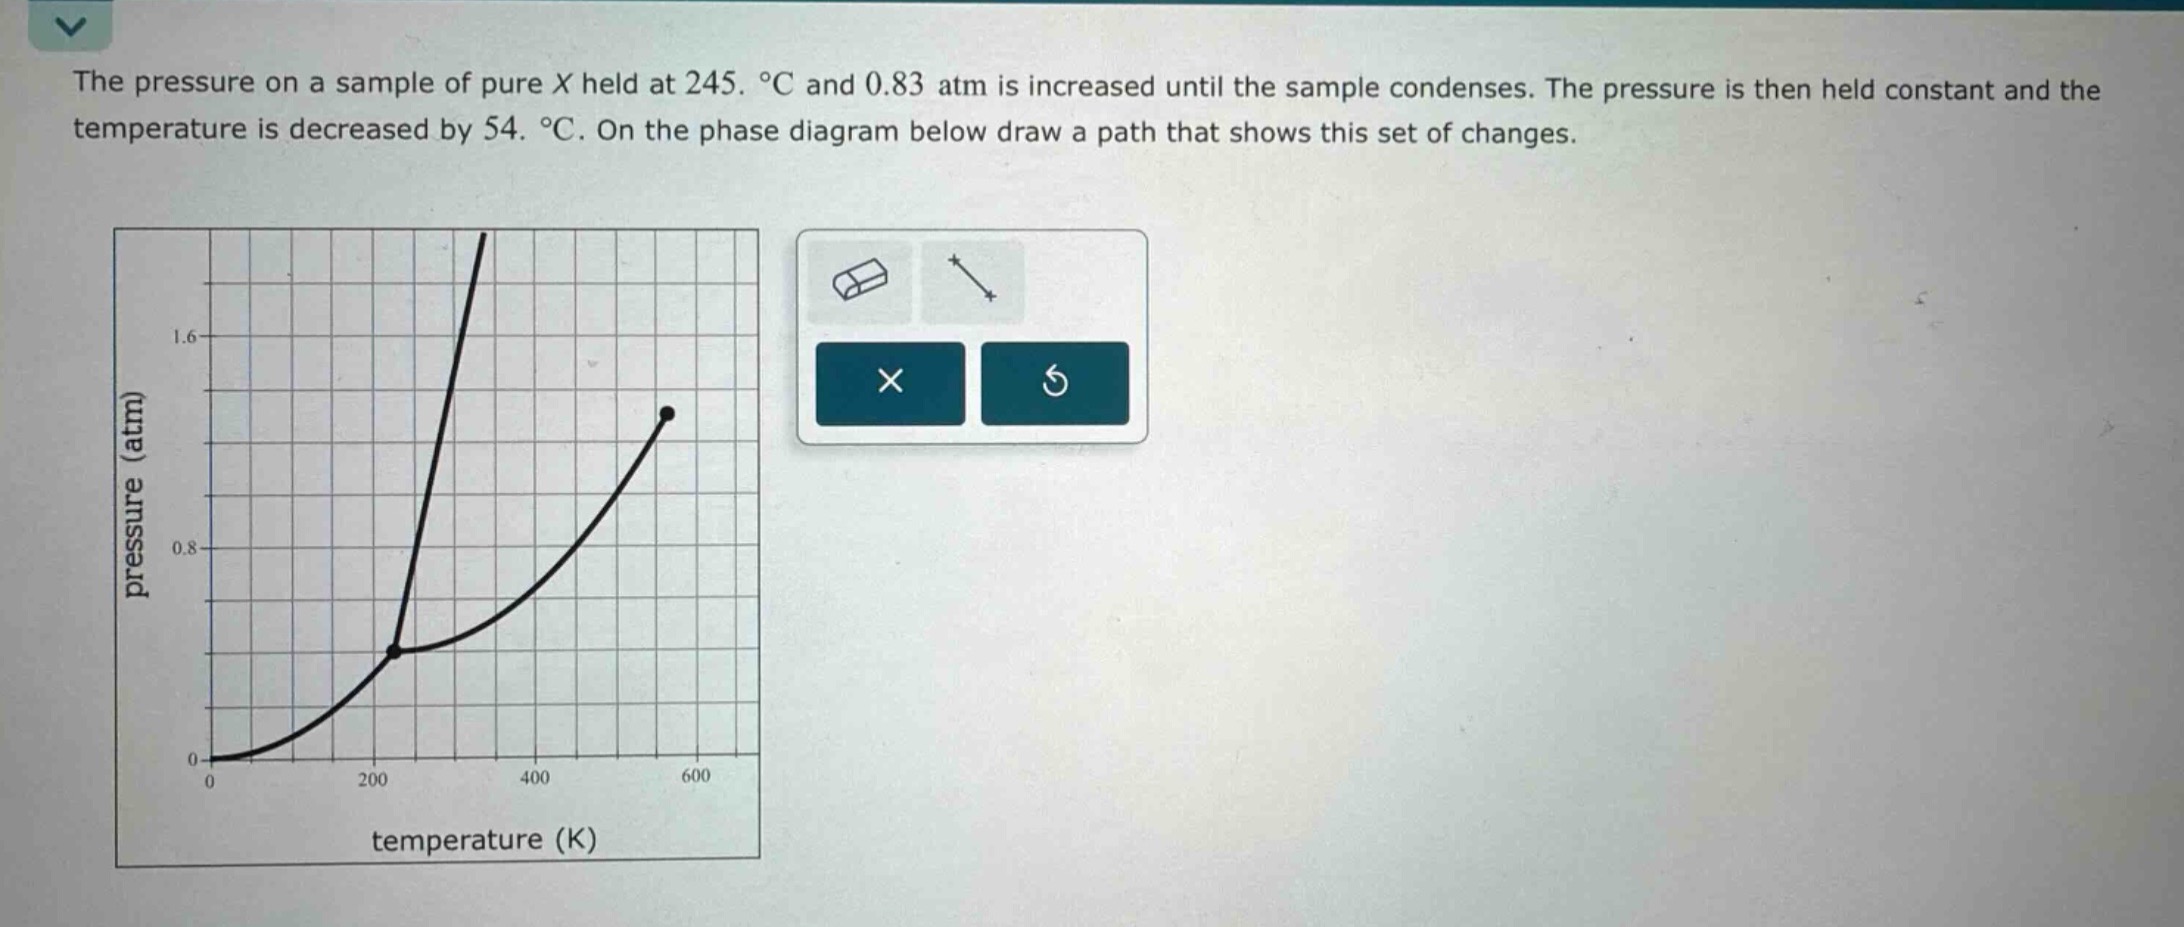
the pressure on a sample of pure x held at 245. °c and 0.83 atm is increased until the sample condenses. the pressure is then held constant and the temperature is decreased by 54. °c. on the phase diagram below draw a path that shows this set of changes.
Answer
Explanation:
Step1: Convert initial temperature to Kelvin.
The initial temperature is given as $245 \ ^{\circ}C$. To use it with the phase diagram, which has temperature in Kelvin, we convert it: $T_1 = 245 \ ^{\circ}C + 273.15 = 518.15 \ K$
Step2: Determine condensation pressure ($P_2$).
The sample is held at $T_1 = 518.15 \ K$, and its pressure is increased from $P_1 = 0.83 \ atm$ until it condenses. Condensation occurs on the gas-liquid phase boundary. We estimate this pressure ($P_2$) from the graph. The curve passes through approximately $(500 \ K, 1.0 \ atm)$ and $(550 \ K, 1.4 \ atm)$. Using linear interpolation for $T_1 = 518.15 \ K$: $P_2 = 1.0 \ atm + \left( \frac{518.15 \ K - 500 \ K}{550 \ K - 500 \ K} \right) \times (1.4 \ atm - 1.0 \ atm)$ $P_2 = 1.0 \ atm + \left( \frac{18.15}{50} \right) \times 0.4 \ atm$ $P_2 = 1.0 \ atm + 0.363 \times 0.4 \ atm$ $P_2 = 1.0 \ atm + 0.1452 \ atm \approx 1.15 \ atm$ So, the first segment of the path is from $(518.15 \ K, 0.83 \ atm)$ to $(518.15 \ K, 1.15 \ atm)$.
Step3: Determine final temperature ($T_2$).
The pressure is then held constant at $P_2 \approx 1.15 \ atm$, and the temperature is decreased by $54 \ ^{\circ}C$. A temperature decrease of $54 \ ^{\circ}C$ is equivalent to a decrease of $54 \ K$. $T_2 = T_1 - 54 \ K = 518.15 \ K - 54 \ K = 464.15 \ K$ The final point of the path is $(464.15 \ K, 1.15 \ atm)$. The second segment of the path is from $(518.15 \ K, 1.15 \ atm)$ to $(464.15 \ K, 1.15 \ atm)$.
Answer:
The path starts at the initial point $(518.15 \ K, 0.83 \ atm)$.
- Draw a vertical line upwards from $(518.15 \ K, 0.83 \ atm)$ to $(518.15 \ K, 1.15 \ atm)$. This represents the isothermal pressure increase until condensation occurs.
- From $(518.15 \ K, 1.15 \ atm)$, draw a horizontal line to the left to the point $(464.15 \ K, 1.15 \ atm)$. This represents the isobaric cooling. The final point is $(464.15 \ K, 1.15 \ atm)$.