rob measures the solubility of three different salts in water at 22°c. which type of graph should he use to…
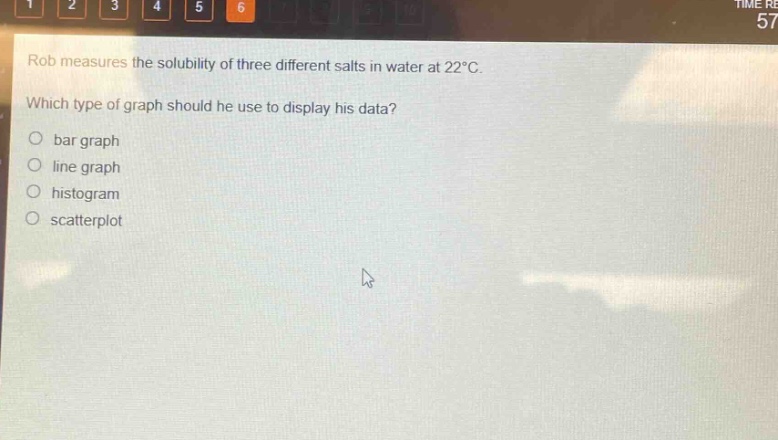
rob measures the solubility of three different salts in water at 22°c. which type of graph should he use to display his data? bar graph line graph histogram scatterplot
Answer
Answer:
A. bar graph
Brief Explanations:
Bar graphs are good for comparing discrete data, like solubility of different salts.