which type of information is best represented by a chart?\no the sequence of chemical reactions in…
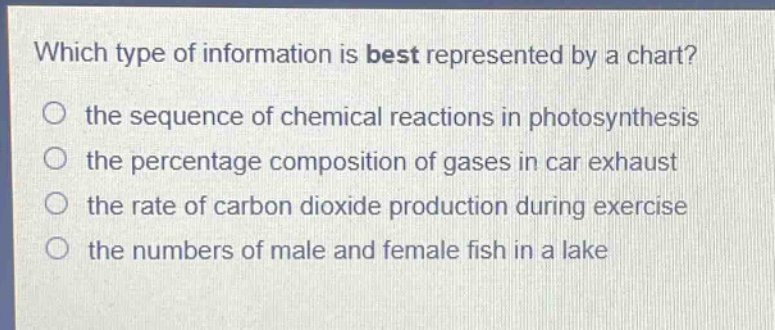
which type of information is best represented by a chart?\no the sequence of chemical reactions in photosynthesis\no the percentage composition of gases in car exhaust\no the rate of carbon dioxide production during exercise\no the numbers of male and female fish in a lake
Answer
Brief Explanations:
Charts are great for showing proportions. The percentage composition of gases in car exhaust represents proportions, making it ideal for a chart. A sequence is better with a flowchart, a rate - time relationship might be better with a graph, and simple counts can be shown in a table or list but not as effectively as proportions in a chart.
Answer:
the percentage composition of gases in car exhaust