a venn diagram is used to compare and contrast different topics. the items that are unique to each topic are…
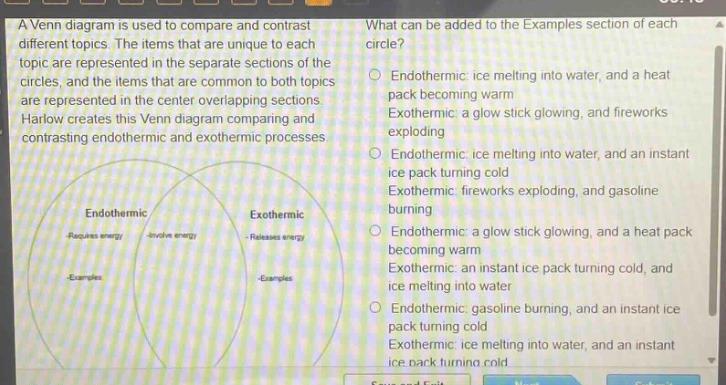
a venn diagram is used to compare and contrast different topics. the items that are unique to each topic are represented in the separate sections of the circles, and the items that are common to both topics are represented in the center overlapping sections. harlow creates this venn diagram comparing and contrasting endothermic and exothermic processes. what can be added to the examples section of each circle? endothermic: ice melting into water, and a heat pack becoming warm exothermic: a glow stick glowing, and fireworks exploding endothermic: ice melting into water, and an instant ice pack turning cold exothermic: fireworks exploding, and gasoline burning endothermic: a glow stick glowing, and a heat pack becoming warm exothermic: an instant ice pack turning cold, and ice melting into water endothermic: gasoline burning, and an instant ice pack turning cold exothermic: ice melting into water, and an instant ice pack turning cold
Answer
Answer:
B. Endothermic: ice melting into water, and an instant ice pack turning cold Exothermic: fireworks exploding, and gasoline burning
Explanation:
Step1: Define endothermic and exothermic
Endothermic processes absorb energy, exothermic release it.
Step2: Analyze each option
- Option A: Heat - pack becoming warm is exothermic, wrong for endothermic list.
- Option B: Ice - melting and ice - pack cooling are endothermic (absorb heat). Fireworks and gasoline burning are exothermic (release heat).
- Option C: Glow - stick glowing is exothermic, wrong for endothermic list.
- Option D: Gasoline burning is exothermic, wrong for endothermic list.