what can you conclude from the graph? the reaction that causes a firework to explode requires less energy to…
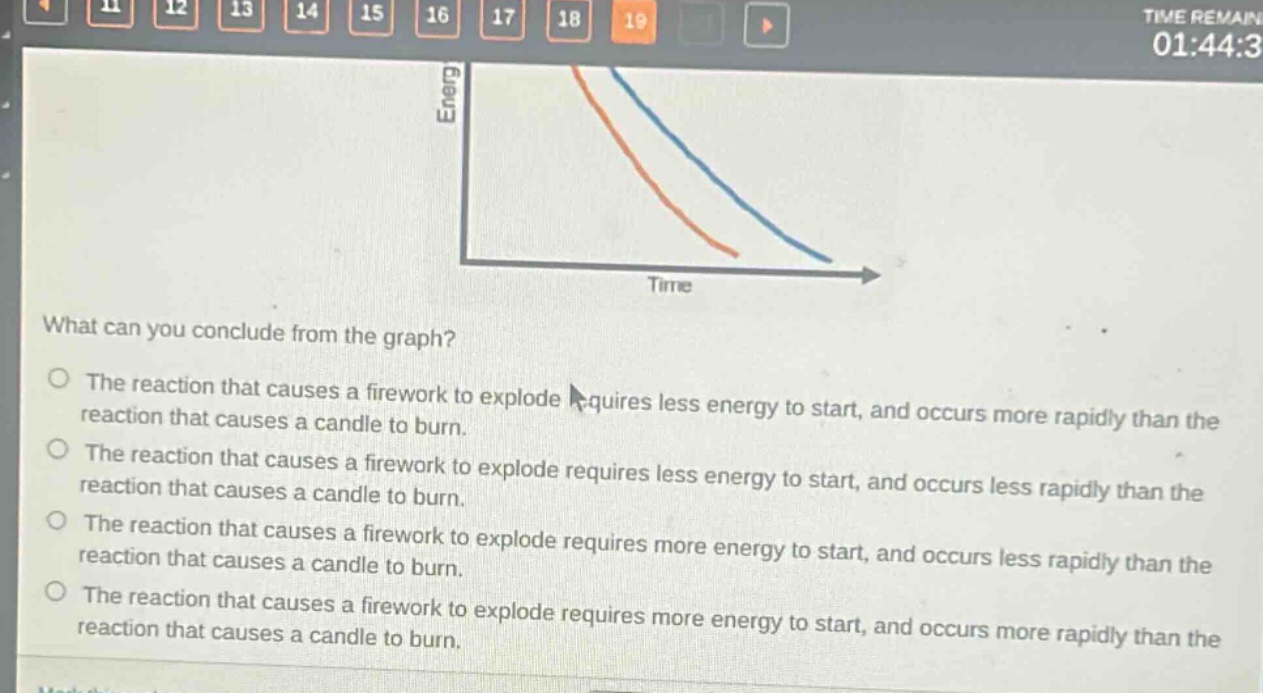
what can you conclude from the graph? the reaction that causes a firework to explode requires less energy to start, and occurs more rapidly than the reaction that causes a candle to burn. the reaction that causes a firework to explode requires less energy to start, and occurs less rapidly than the reaction that causes a candle to burn. the reaction that causes a firework to explode requires more energy to start, and occurs less rapidly than the reaction that causes a candle to burn. the reaction that causes a firework to explode requires more energy to start, and occurs more rapidly than the reaction that causes a candle to burn.
Answer
Brief Explanations:
The steeper the slope of the energy - time graph, the more rapid the reaction. A lower starting - point on the energy axis indicates less energy required to start the reaction. Assuming one line represents the firework explosion and the other the candle - burning reaction, the steeper line (more rapid reaction) and the lower - starting line (less energy to start) can be used to make a conclusion.
Answer:
The reaction that causes a firework to explode requires less energy to start, and occurs more rapidly than the reaction that causes a candle to burn.