according to the chart, the marginal revenue\n\ndecreases by ten dollars as production increases.\n\nincrease…
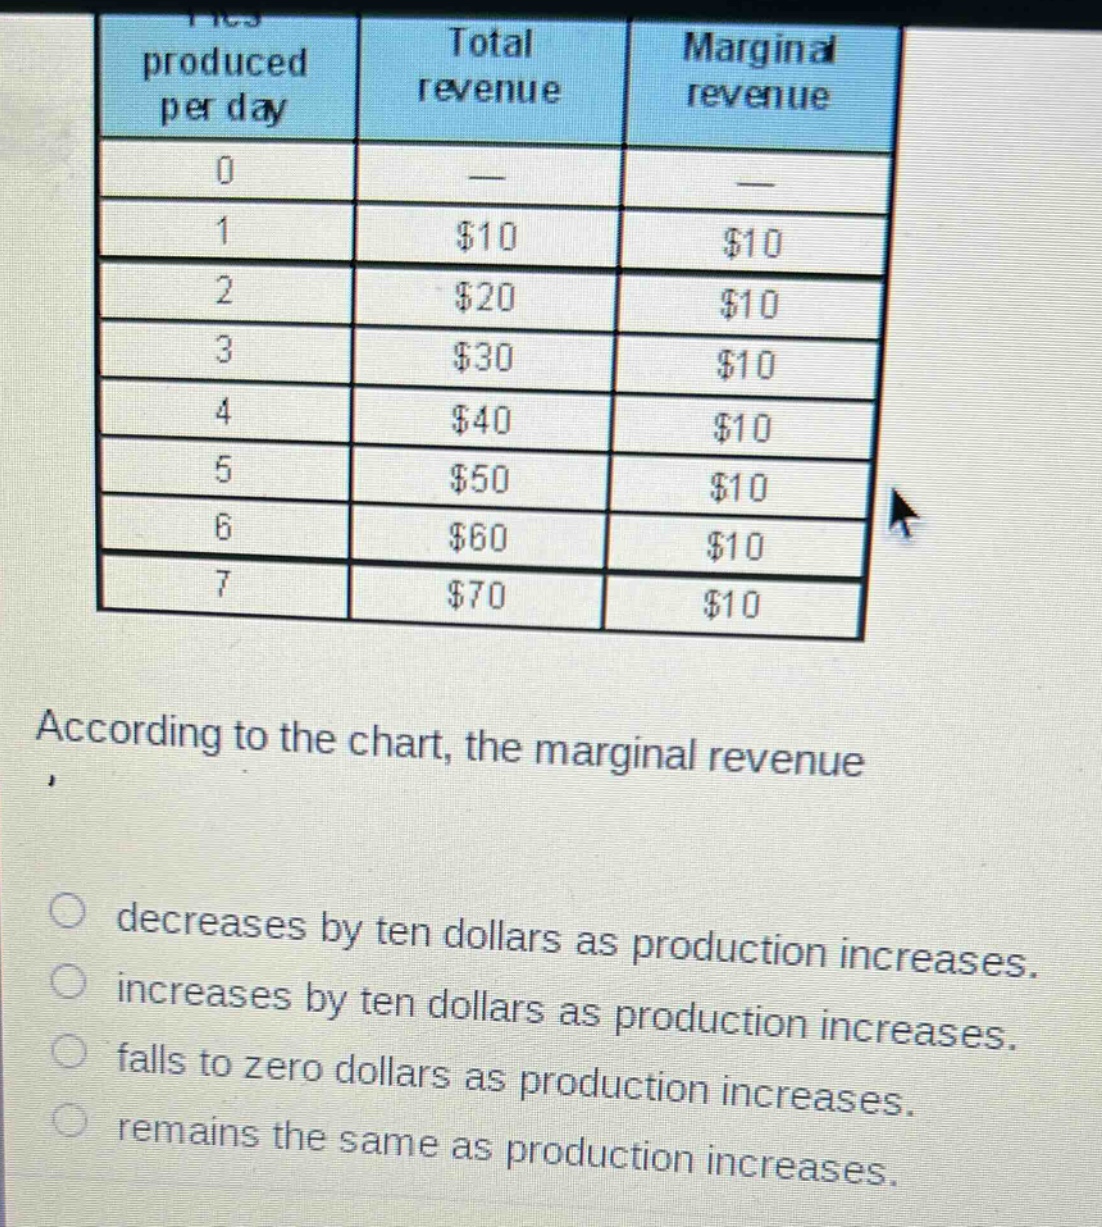
according to the chart, the marginal revenue\n\ndecreases by ten dollars as production increases.\n\nincreases by ten dollars as production increases.\n\nfalls to zero dollars as production increases.\n\nremains the same as production increases.
Answer
Explanation:
Step1: Observe the marginal - revenue values
Check the values in the marginal - revenue column of the table.
Step2: Analyze the trend
As the quantity produced per day increases from 1 to 7, the marginal revenue is $10 for each level of production.
Answer:
remains the same as production increases.