analyzing the market\nexcess supply\n\a\ represents the new quantity demanded, while \b\ represents the new…
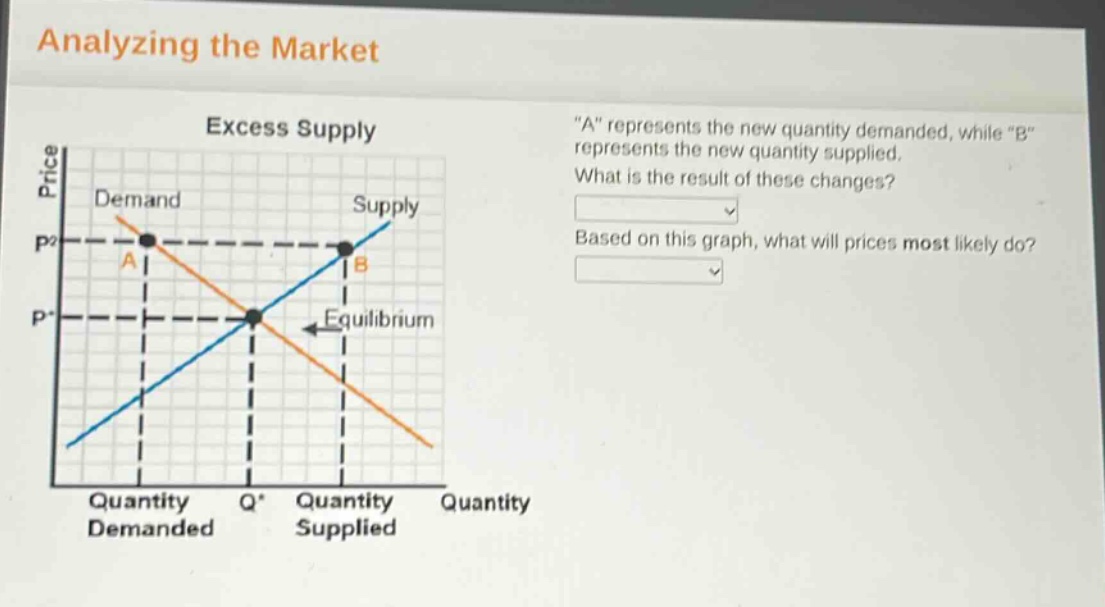
analyzing the market\nexcess supply\n\a\ represents the new quantity demanded, while \b\ represents the new quantity supplied.\nwhat is the result of these changes?\nbased on this graph, what will prices most likely do?
Answer
Explanation:
Step1: Analyze market - excess supply
At price $P_2$, quantity supplied (B) is greater than quantity demanded (A), resulting in excess supply.
Step2: Determine price movement
In a market with excess supply, sellers will compete to sell their goods, driving prices down.
Answer:
The result of these changes is excess supply. Prices will most likely decrease.