analyzing the market\nuse this graph to answer the following questions.\nin this example, what is occurring…
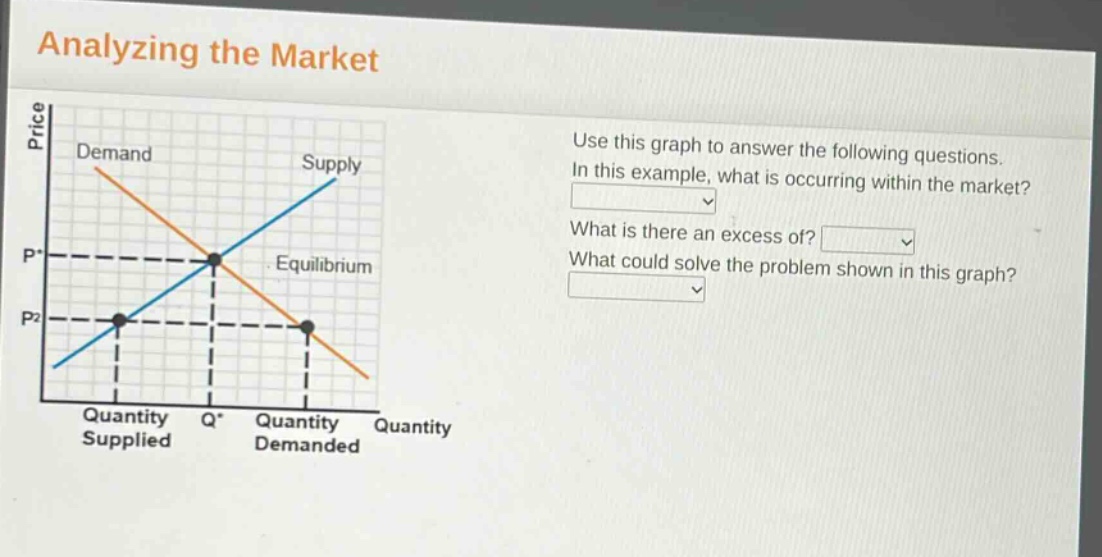
analyzing the market\nuse this graph to answer the following questions.\nin this example, what is occurring within the market?\nwhat is there an excess of?\nwhat could solve the problem shown in this graph?
Answer
Explanation:
Step1: Analyze market situation
At price $P_2$, quantity supplied is greater than quantity demanded.
Step2: Identify excess
Since quantity supplied > quantity demanded, there is an excess supply.
Step3: Suggest solution
Lowering the price would increase quantity demanded and decrease quantity supplied, moving towards equilibrium.
Answer:
- There is a surplus (excess - supply) in the market.
- There is an excess of supply.
- Lowering the price could solve the problem.