annual change in us unemployment and gdp 2005 - 2012\nin what year would someone looking for work have had…
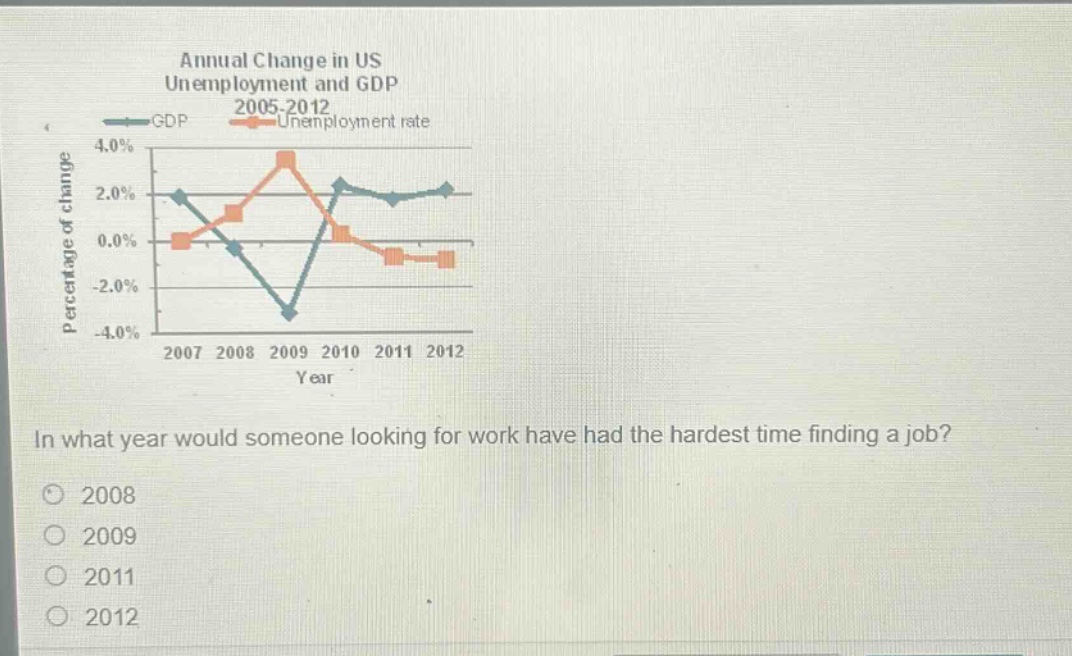
annual change in us unemployment and gdp 2005 - 2012\nin what year would someone looking for work have had the hardest time finding a job?\n2008\n2009\n2011\n2012
Answer
Explanation:
Step1: Analyze the unemployment - rate graph
The higher the unemployment rate, the harder it is to find a job.
Step2: Identify the peak of the unemployment - rate curve
By observing the orange curve (unemployment rate) in the graph, we can see that it reaches its highest point in 2009.
Answer:
2009