the annual inflation rate is 3.5% per year. if a movie costs $7.50, determine which of the following graphs…
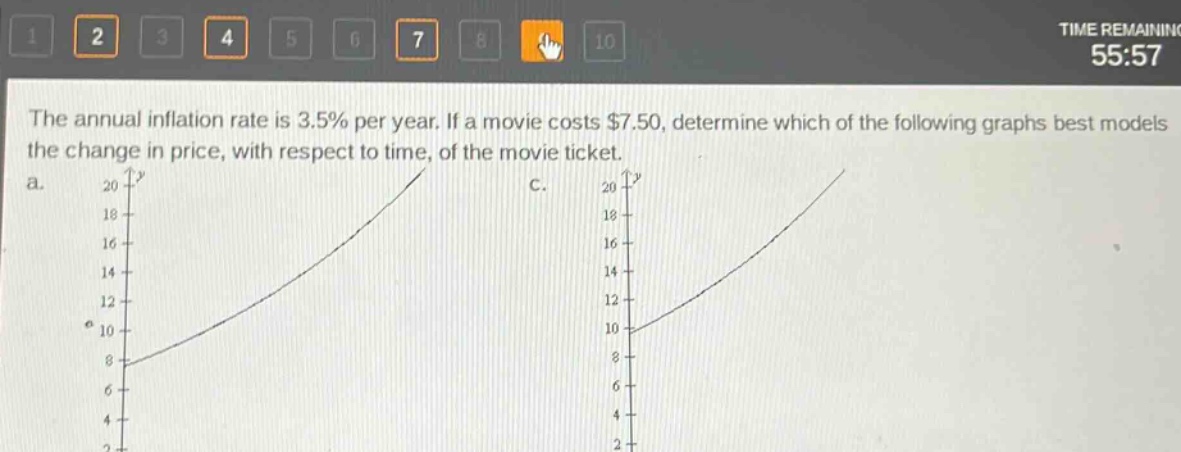
the annual inflation rate is 3.5% per year. if a movie costs $7.50, determine which of the following graphs best models the change in price, with respect to time, of the movie ticket.
Answer
Explanation:
Step1: Identify the growth - model formula
The formula for compound - growth due to inflation is $P(t)=P_0(1 + r)^t$, where $P_0$ is the initial price, $r$ is the inflation rate as a decimal, and $t$ is the time in years. Here, $P_0 = 7.50$ and $r=0.035$.
Step2: Analyze the initial condition
When $t = 0$, $P(0)=P_0(1 + r)^0=P_0 = 7.50$. So the graph should start at the point $(0,7.50)$.
Step3: Analyze the nature of the function
Since $r>0$, the function $P(t)=7.50(1 + 0.035)^t=7.50\times1.035^t$ is an exponential growth function. The general form of an exponential growth function $y = a\times b^t$ ($a>0,b > 1$) has a positive - valued $y$ - intercept and increases as $t$ increases.
The graph should start at $y = 7.50$ when $x = 0$ and increase exponentially. Without seeing the full set of options, we know that the correct graph will have a $y$ - intercept of 7.50 and be an increasing exponential curve.
If we assume the two graphs shown are the only options: The first graph (a) seems to start below 8, close to 7.5, and is an increasing exponential curve. The second graph (c) starts above 8. So the answer is the graph that starts at approximately $y = 7.5$ when $x = 0$ and is an increasing exponential curve.